FIGURE

Figure 6

ID
ZDB-FIG-250701-33
Publication
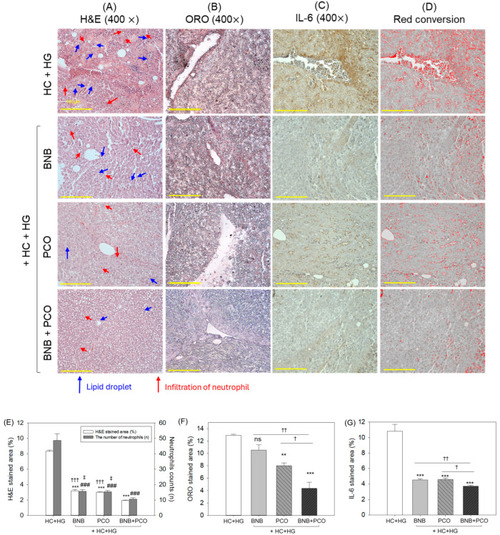
Cho et al., 2025 - Synergistic Effect of Banaba Leaf Extract and Policosanol (Raydel®) Ameliorate High Cholesterol and High Galactose-Diet Induced Adverse Events in Zebrafish
Other Figures
All Figure Page
Back to All Figure Page
Figure 6

Histological analysis of hepatic tissue after 6 weeks of consumption of banaba (BNB, 0.1% w/w), policosanol (PCO, 0.1% w/w), and mixture of the banaba and policosanol (BNB+PCO, each 0.1%, w/w) supplemented with high cholesterol (HC, 4% w/w) and high galactose (HG, 30% w/w) diet. (A) Hematoxylin and eosin (H&E) staining, (B) oil red O (ORO) staining, (C) immunohistochemical analysis to detect interleukin 6 (IL-6), and (D) red conversion of the IL-6-stained area (to improve the visibility) using brown color threshold value 20–120 employing Image J software (https://imagej.net/ij, 1.53 version, accessed on 6 June 2023). (E) Quantification of H&E-stained area and neutrophil counts. (F,G) Quantification of ORO, and IL-6-stained area. The ** and *** underscore the significant variance at p < 0.01, p < 0.001 (for H&E, ORO, and IL-6-stained area), while ### underscore the statistical difference at p < 0.001 (for neutrophil counts) vs. HC+HG group. The , ††, and ††† highlight statistical differences at p < 0.05, p < 0.01, and p < 0.001 (for H&E and IL-6-stained area), while represents the statistical difference at p < 0.05 (for neutrophil counts) vs. BNB+PCO group. The “ns ” highlights the non-significant difference vs. HC+HG group.

Expression Data

Expression Detail
Antibody Labeling
Phenotype Data

Phenotype Detail
Acknowledgments
This image is the copyrighted work of the attributed author or publisher, and ZFIN has permission only to display this image to its users. Additional permissions should be obtained from the applicable author or publisher of the image. Full text @ Pharmaceuticals (Basel)