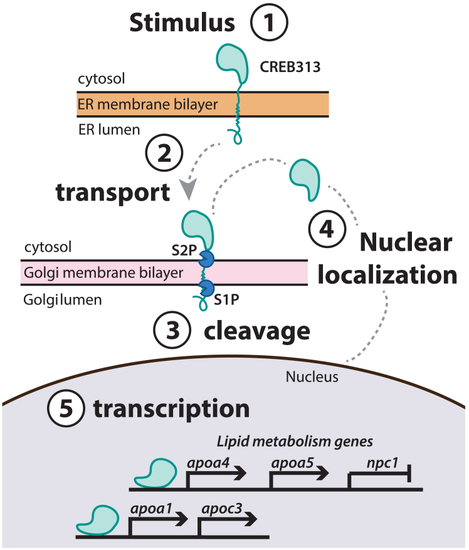
Process of CREB3L3 nuclear localization. 1: In the inactive state, CREB3L3 is anchored to the membrane of the endoplasmic reticulum (ER). 2: An unknown signal induces the release of the tethered protein from the ER membrane, and CREB3L3 is transported to the Golgi. 3: Proteases (S1P, S2P) cleave the transmembrane domain of the protein in the Golgi. 4: Upon cleavage, the DNA-binding domain of the protein can be trafficked to the nucleus. 5: CREB3L3 regulates expression of key lipid metabolism and apoprotein genes by binding to promoter regions and altering transcriptional processes in the nucleus. CREB3L3, cAMP-responsive element-binding protein 3–like 3.
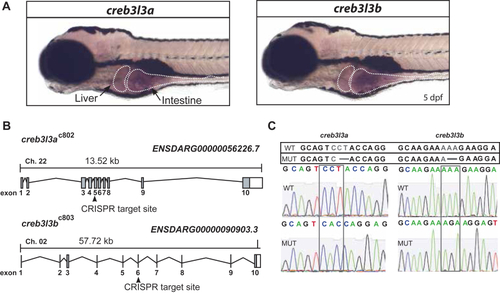
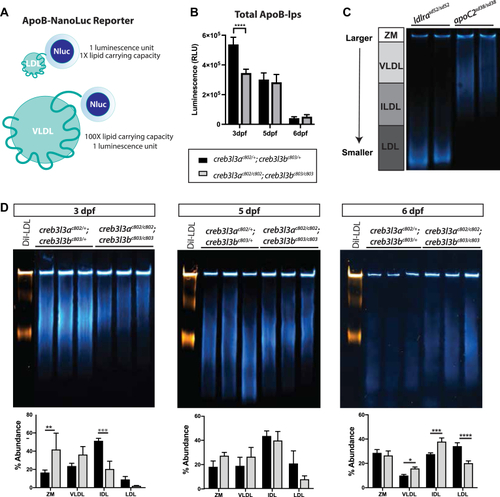
Generation of creb3l3a and creb3l3b zebrafish mutants. A: Representative images of whole-mount in situ hybridization (ISH) with sense and antisense probes targeting zebrafish creb3l3a (ENSDARG00000056226.7) and creb3l3b (ENSDARG00000090903.3) at 6 days post fertilization (dpf). Both creb3l3a and creb3l3b mRNA is expressed in the liver and the intestine at 6 dpf (white outlines). No signal is observed with sense probes. Images are representative of 3 independent clutches: 6–12 animals per clutch. B: Overview of gene loci and strategy used for CRISPR/Cas9 targeting of creb3l3a and creb3l3b. The fifth exon was targeted by CRISPR guide RNA in creb3l3a, and the sixth exon was targeted in creb3l3b. C: Sanger sequencing confirms 2-bp deletions in both creb3l3a and creb3l3b (nucleotides depicted in gray show the affected codon causing a frameshift; dotted box around sequence trace confirms codon change by loss of 2 base pairs). Creb3l3, cAMP-responsive element-binding protein 3–like 3.

EXPRESSION / LABELING:
Genes:
Fish:
Anatomical Terms:
Stage: Day 5

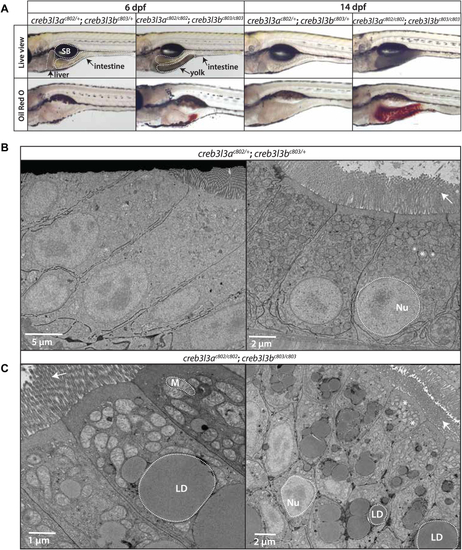
Accumulation of cytoplasmic lipid droplets in the enterocyte of creb3l3 mutant animals. A: Representative brightfield live images of creb3l3ac802/+;creb3l3bc803/+ and creb3l3ac802/c802;creb3l3bc803/c803 zebrafish larvae at 6 dpf. Unfed 6 dpf creb3l3 double mutants retain yolk and exhibit a yolk opacity phenotype compared to double heterozygous siblings, which suggests abnormal lipid droplet accumulation in the yolk syncytial layer. creb3l3ac802/c802;creb3l3bc803/c803 animals exhibit abnormal lipid accumulation by Oil Red O (ORO) staining in the posterior region of the yolk at 6 dpf. Images are representative of 3 independent experiments with 5–9 animals per experiment. Fasted 14 dpf creb3l3 mutants have opaque intestines under brightfield (Live view) and increased ORO staining throughout the intestine in fasted fish at 14 dpf. creb3l3ac802/+;creb3l3bc803/+ animals do not stain with ORO. Images are representative of 3 independent experiments with 5–9 animals per experiment. B: Representative electron microscopy images of creb3l3ac802/+;creb3l3c803/+ and creb3l3ac802/c802;creb3l3bc803/c803 animals fasted at 14 dpf (C). Large lipid droplets (LD) are present in creb3l3ac802/c802;creb3l3bc803/c803 animals. Images are representative of 3–6 animals per genotype. The nucleus and mitochondria are outlined by white dotted lines and lipid droplets are outlined by a solid line. Arrows points to microvilli on the apical side of the enterocyte. Creb3l3, cAMP-responsive element-binding protein 3–like 3; dpf, days post fertilization; Nu, nucleus; M, mitochondria; SB, swim bladder.

creb3l3 target genes are not induced in creb3l3 mutant intestines following a high-fat meal. A: creb3l3 target genes are clustered together on zebrafish Chr 16 and Chr 19. B: HFM-induced apoea expression in creb3l3ac802/+;creb3l3bc803/+ animals, but not in double mutants. Similarly, apoeb (C) and apoa4a (D) expression increases in creb3l3ac802/+;creb3l3bc803/+ animals after an HFM, but this response is attenuated in creb3l3ac802/c802;creb3l3bc803/c803 animals. E: apobb.1 expression is not significantly changed between creb3l3 double heterozygotes and double homozygotes after an HFM. A failure to induce mRNA expression of apoa4b.1 (F), apoa4b.2 (G), and apoa4b.3 (H) was also noted in creb3l3 mutants after an HFM. Relative mRNA expression of each gene was normalized to 18S RNA. N = 3 clutches; n = 6–14 individuals per clutch per condition. One way ANOVA with Tukey’s multiple comparisons. ∗∗∗∗P < 0.0001, ∗∗∗P < 0.001, ∗∗P < 0.01, and ∗P < 0.05. Creb3l3, cAMP-responsive element-binding protein 3–like 3; HFM, high-fat meal.

creb3l3ac802/c802;creb3l3bc803/c803 mutants have fewer and larger ApoB-lps at 3 dpf. A: Schematic of LipoGlo reporter on differently sized ApoB-lps. B: Quantification of total ApoB-lps in creb3l3ac802;creb3l3bc803 mutants compared to double heterozygous siblings (creb3l3ac802/+;creb3l3bc803/+) from 3 to 6 dpf. All fish used in these experiments were heterozygous for the ApoBb.1-NanoLuc reporter. Three independent experiments, 8–12 individuals per genotype. One-way ANOVA, ∗∗∗∗P < 0.001. C: ApoB-lp particle size distributions of 6 dpf ldlrasd52 mutant and apoc2sd38 mutant homogenate for comparison. D: Native PAGE shows size distribution of ApoB-lp in creb3l3 double homozygous mutants from 3 to 6 dpf compared to creb3l3 double heterozygous siblings. Gel images are a composite of chemiluminescent signal (LipoGlo, blue) and fluorescent (DiI-LDL, orange) exposures. DiI-labeled human LDL sample (L3482, Thermo Fisher Scientific) is run in the first lane of each gel as a migration standard. Human Dil-LDL migrates more slowly than NanoLuc-labeled LDL due to the addition of the DiI label. Quantification of luciferase signal on Native PAGE at 3, 5, and 6 dpf by percent abundance of signal within a lane. Gels images are representative of three independent experiments. One-way ANOVA with Tukey’s multiple comparisons. N = 3 clutches; 3–12 individuals per genotype per clutch. ∗∗P < 0.01; ∗∗∗P < 0.005; and ∗∗∗∗P < 0.001. ApoB-lp, apolipoprotein-B–containing lipoprotein; Creb3l3, cAMP-responsive element-binding protein 3–like 3; DiI-LDL, DiI-labeled LDL; dpf, days post fertilization; IDL, intermediate-density lipoprotein; ZM, zero mobility.

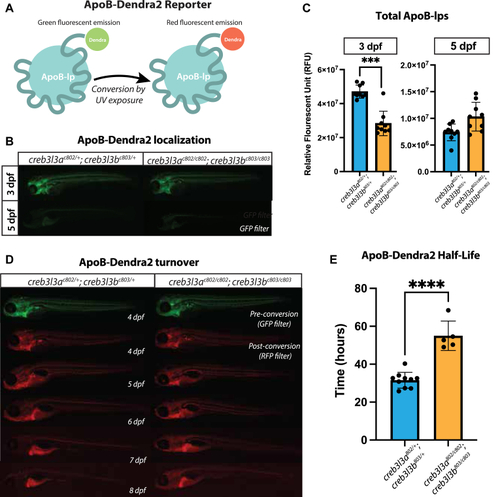
ApoB-Dendra2 reporter localization in creb3l3 mutants. A: Schematic of ApoB-Dendra2 fusion. Dendra2 is endogenously fused to the C terminus of ApoBb.1 for in vivo characterization of the ApoB-lp profile. The unconverted form of Dendra2 is visualized with a GFP filter. UV exposure irreversibly photoconverts Dendra2 to emit fluorescence visualized by the RFP filter. B: GFP filter showing ApoB-Dendra2 signal in 3 and 5 dpf zebrafish in creb3l3 double homozygous and double heterozygous siblings. Images are representative of 3 independent clutches; in each clutch, there were 4–10 animals per genotype. All fish used in these experiments were homozygous for the ApoBb.1-Dendra2 reporter and were compared to apoBb.1+/+ for background fluorescence. Unpaired t-tests ∗∗∗P < 0.0005. C: Quantification of fluorescent signal at 3 and 5 dpf. n = 9–10 animals per genotype. D: Representative images of ApoB-Dendra2 reporter in creb3l3 double homozygous mutants and creb3l3 double heterozygous siblings. The same fish is imaged every 24 h from 4 to 8 dpf. Before UV exposure (preconversion) images were taken using the GFP filter and pseudo-colored green. After UV exposure (post conversion) images were taken using an RFP filter and pseudo-colored red. Images are representative of three independent clutches; in each clutch, there were 4–10 animals per genotype. E: Quantification of RFP fluorescent signal from 4 to 8 dpf to measure half-life of ApoB-Dendra2 particles. N = 3 clutches; n = 4–10 individuals per genotype per clutch; unpaired t-tests ∗∗∗∗P < 0.0001. ApoB-lp, apolipoprotein-B–containing lipoprotein; Creb3l3, cAMP-responsive element-binding protein 3–like 3; dpf, days post fertilization.

The loss of Creb3l3 may affect lipid secretion from the enterocyte. A: Fluorescent signal of BODIPY-C12 within intestinal homogenate over 24 h post gavage shows no significant difference between apoC2sd38 animals and apoC2sd38/+ control animals. B: 24-h postprandial trend of BODIPY-FL C12 fluorescent signal in blood plasma. Fluorescent signal in apoC2sd38 animals remains elevated from 4 h to 24 h post gavage compared to apoC2sd38/+ animals. C: Fluorescent signal within intestinal homogenate over 24 h post gavage. Creb3l3 mutants show slightly less total fluorescence over time, yet there is no significant difference between creb3l3 double homozygous mutants and creb3l3 double heterozygote control animals. D: Blood plasma BODIPY-FL C12 fluorescent signal is reduced in creb3l3 double homozygous mutants and significantly different at 6 h post gavage. For each experiment, the mean fluorescent signal at each time point was divided by the mean fluorescent value of the control (heterozygotes) at t = 0 to calculate the fold change between the individual genotypes. The average fold change for each experiment was plotted. n = 3 individual fish of each genotype at each time point for each experiment; three independent experiments for each time course. ∗ = P < 0.05, Two-way ANOVA with multiple comparisons. Creb3l3, cAMP-responsive element-binding protein 3–like 3.

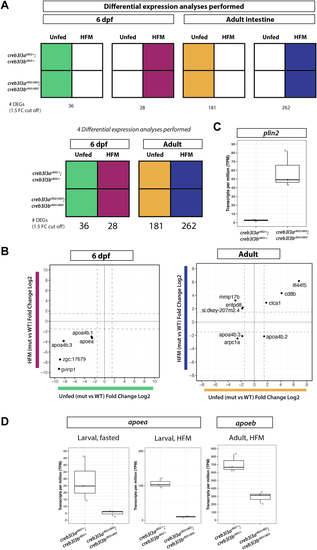
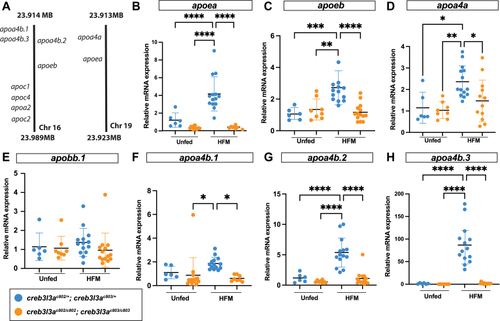
RNA sequencing analysis of creb3l3 mutants at larval and adult stages. A: Visual description of the 4 different analyses performed. Using a cut off of 1.5 for log2 fold change (FC), 6 dpf unfed creb3l3 double mutants have 36 differentially expressed genes (DEGs) compared to double heterozygous siblings (green analysis). After a high-fat meal (HFM), 6 dpf creb3l3 double mutants have 28 DEGs (pink). The number of DEGs significantly increases in adult animals. In the unfed state, creb3l3 double mutant adults have 181 DEGs (orange), and after an HFM, creb3l3 adults had 262 DEGs compared to double heterozygous siblings (blue analysis). B: The lists of DEGs between each feeding condition were compared for each age group and cross plotted (green versus pink and orange versus blue). In 6 dpf animals, apoa4b.1, apoa4b.3, apoea, zgc:17,679, and gvinp1 were genes that were downregulated in creb3l3 mutants in both feeding conditions. In adult animals, clca1, cd8b, and ifi44f5 are upregulated in creb3l3 mutants in both unfed and fed conditions. apoa4b.2 is upregulated in unfed, adult creb3l3 mutants, but downregulated after a HFM. mmp17b, entpd8, and si:dkey-207m2.4 are upregulated in creb3l3 mutants after a HFM but downregulated in unfed creb3l3 mutants. apoa4b.3 and arpc1a are downregulated in creb3l3 mutant adults regardless of feeding. C: plin2 expression fasted creb3l3 adults. D: Expression of apoea and apoeb is downregulated in larval and adult creb3l3 mutants. Creb3l3, cAMP-responsive element-binding protein 3–like 3; dpf, days post fertilization; Plin, perilipin.

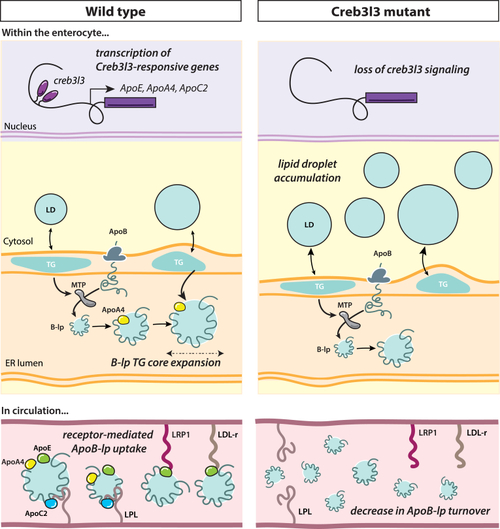
Summary of results and hypothetical model. Creb3l3 signaling activates Creb3l3-responsive genes such as ApoC2, ApoE, and ApoA4. We found that loss of Creb3l3 results in an increase of cytoplasmic lipid droplets in the enterocytes likely due to the loss of ApoA4. It is speculated that ApoA4 is responsible for expanding the size of the ApoB-lp through the addition of triglyceride potentially in poorly understood post ER steps. If enterocytes are unable to enlarge particles, the enterocyte may be directing excess lipid to cytoplasmic lipid droplets for storage. In circulation, ApoE facilitates the uptake of B-lp by peripheral tissues. In our study, we hypothesize that the increase of ApoB-lp half-life, or decrease of ApoB-lp turnover, is a direct result of the loss of ApoE from the ApoB-lp particle. ApoB-lp, apolipoprotein-B–containing lipoprotein; B-lp, ApoB-containing lipoprotein; Creb3l3, cAMP-responsive element-binding protein 3–like 3; ER, endoplasmic reticulum; LDL-r and LRP1, members low-density lipoprotein receptor family; LPL, lipoprotein lipase; MTP, microsomal triglyceride transfer protein; TG, triglyceride.

Acknowledgments
This image is the copyrighted work of the attributed author or publisher, and ZFIN has permission only to display this image to its users. Additional permissions should be obtained from the applicable author or publisher of the image. Full text @ J. Lipid Res.