
- Title
-
IGF2BP1 restricts the induction of human primordial germ cell fate in an m6A-dependent manner
- Authors
- Zhang, J., Gu, Y., Tong, L., Feng, B., Dong, S., Shao, Q., Chen, Y., Tu, H., Wang, Z., Wang, Y., Li, X., Yu, H., Lin, Z., Wang, X., Li, Z., Ai, Z., Xiang, Y., Jiang, Z., Jin, Z., Li, Z., Chen, Y., Shen, Z., Huang, C., Liu, J., Liu, J., Xu, P., Yu, Y., Xia, P., Liang, H., Huang, H., Chen, D.
- Source
- Full text @ Cell Stem Cell
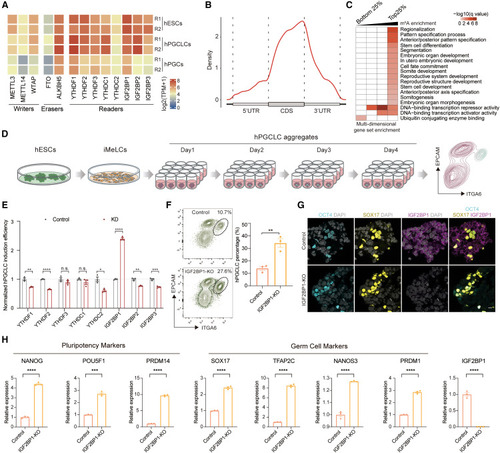
The m6A reader IGF2BP1 suppresses hPGCLCs induced from hESCs (A) Expression levels of m6A writers, erasers, and readers in hESCs, hPGCLCs, and hPGCs. (B) Enrichment of m6A modifications across mRNA transcriptome in hESCs. CDS: coding sequence. UTR: untranslated regions. (C) Heatmap showing gene set enrichment analysis for m6A-modified genes in hESCs. (D) Illustration of hESC to hPGCLC differentiation strategy. (E) Normalized hPGCLC induction efficiency for CRISPRi screening the m6A readers (mean ± SEM, n = 3, biological replicates; n.s., not significant, ∗p < 0.05, ∗∗p < 0.01, ∗∗∗p < 0.001, ∗∗∗∗p < 0.0001, unpaired t test). (F) Flow cytometry showing the percentage of day-4 hPGCLCs induced from control and IGF2BP1-KO hESCs (mean ± SEM, n = 3, biological replicates; ∗∗p < 0.01, unpaired t test). (G) Immunofluorescence for OCT4 (cyan), SOX17 (yellow), and IGF2BP1 (magenta) for day-4 hPGCLC aggregates induced from control and IGF2BP1-KO hESCs. DAPI (gray) is counterstained for nuclei. Scale bar: 10 μm. (H) qPCR showing the expression of pluripotency and germ cell markers in control and IGF2BP1-KO day-4 hPGCLC aggregates (mean ± SEM, n = 3, technical replicates; ∗∗∗p < 0.001, ∗∗∗∗p < 0.0001, unpaired t test). See also Figure S1 and Tables S1 and S7. |
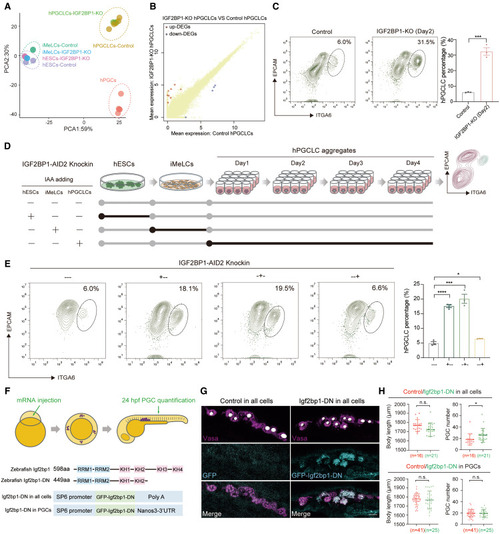
IGF2BP1 is involved in the regulation of hESC to hPGCLC induction (A) PCA plot showing the transcriptomes of control and IGF2BP1-KO hESCs, iMeLCs, day-4 hPGCLCs, and embryonic hPGCs. (B) DEGs of IGF2BP1-KO day-4 hPGCLCs compared with control day-4 hPGCLCs. p value < 0.05. (C) Flow cytometry showing the percentage of day-2 hPGCLCs induced from control and IGF2BP1-KO hESCs (mean ± SEM, n = 3, biological replicates; ∗∗∗p < 0.001, unpaired t test). (D) Schematic illustration showing the design for adding IAA to IGF2BP1-AID2-knockin cells at different stages of hPGCLC induction. (E) Flow cytometry showing the percentage of day-4 hPGCLCs induced from hESCs with IAA added at different stages during hPGCLC induction (mean ± SEM, n = 3, biological replicates; ∗p < 0.05, ∗∗∗p < 0.001, ∗∗∗∗p < 0.0001, unpaired t test). (F) Schematic illustration of experimental design for overexpressing wild-type or dominant negative (DN) forms of Igf2bp1 in all cells or in PGCs only. (G) Immunofluorescence for Vasa (magenta) and GFP (gray) for quantification of PGCs. Scale bar: 10 μm. (H) Quantification of body length and PGC numbers with overexpression of Igf2bp1 (control) and Igf2bp1-DN in all cells and in PGCs. n, Number of PGCs (mean ± SEM, biological replicates; n.s., not significant, ∗p < 0.05, unpaired t test). See also Figure S2 and Table S2. |
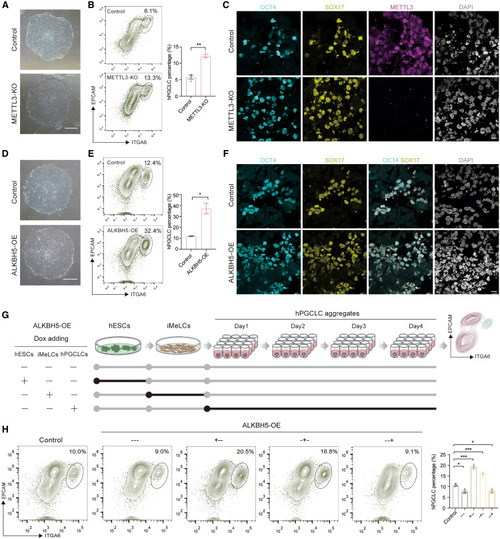
m6A modifications are involved in hPGCLC induction from hESCs (A) Phase contrast images showing the morphology of control and METTL3-KO hESCs. Scale bar: 200 μm. (B) Flow cytometry showing the percentage of day-4 hPGCLCs induced from control and METTL3-KO hESCs (mean ± SEM, n = 3, biological replicates; ∗∗p < 0.01, unpaired t test). (C) Immunofluorescence for OCT4 (cyan), SOX17 (yellow), and METTL3 (magenta) for day-4 hPGCLC aggregates induced from control and METTL3-KO hESCs. DAPI (gray) is counterstained for nuclei. Scale bar: 10 μm. (D) Phase contrast images showing the morphology of control and ALKBH5-OE hESCs. Scale bar: 200 μm. (E) Flow cytometry showing the percentage of day-4 hPGCLCs induced from control and ALKBH5-OE hESCs (mean ± SEM, n = 2, biological replicates; ∗p < 0.05, unpaired t test). (F) Immunofluorescence for OCT4 (cyan) and SOX17 (yellow) for day-4 hPGCLC aggregates induced from control and ALKBH5-OE hESCs. DAPI (gray) is counterstained for nuclei. Scale bar: 10 μm. (G) Schematic illustration showing the design for overexpressing ALKBH5 at different stages of hPGCLC induction. (H) Flow cytometry showing the percentage of day-4 hPGCLCs induced from hESCs with ALKBH5-OE at different stages during hPGCLC induction (mean ± SEM, n = 3, biological replicates; ∗p < 0.05, ∗∗∗p < 0.001, unpaired t test). See also Figure S3. |
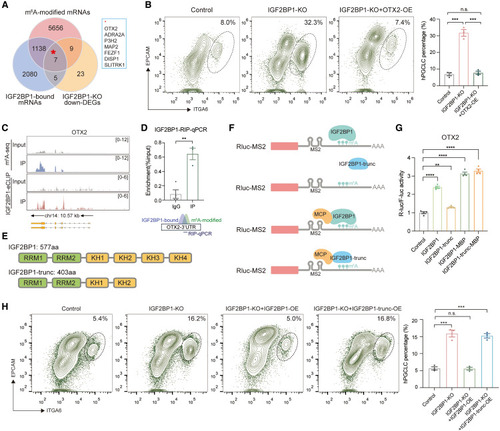
OTX2 mRNA is regulated by m6A modifications to restrict germ cell fate (A) Venn diagram showing the overlap of m6A-modified mRNAs, IGF2BP1-bound mRNAs, and downregulated DEGs (|log2FoldChange| > 2) in IGF2BP1-KO hESCs. (B) Flow cytometry showing the percentage of day-4 hPGCLCs induced from control, IGF2BP1-KO, and IGF2BP1-KO+OTX2-OE hESCs (mean ± SEM, n = 3, biological replicates; n.s., not significant, ∗∗∗p < 0.001, unpaired t test). (C) Tracks showing the m6A-seq peaks and IGF2BP1-eCLIP peaks on OTX2 genomic region. (D) RIP with antibodies against FLAG using IGF2BP1-3xFLAG knockin hESCs. qPCR was performed to determine the binding of IGF2BP1 to the 3′UTR of OTX2. Immunoglobulin G (IgG) served as a control. Enrichment of the indicated genes was normalized to the input level (mean ± SEM, n = 3, technical replicates; ∗∗p < 0.01, unpaired t test). (E) Schematic illustration of full-length and truncation (trunc) forms of IGF2BP1 protein. (F) Schematic illustration of tethering experiments for IGF2BP1 and IGF2BP1-trunc to the 3′UTR of OTX2. (G) Luciferase assay for detecting the activity of IGF2BP1, IGF2BP1-trunc, IGF2BP1-MCP, and IGF2BP1-trunc-MCP on OTX2-3UTR (mean ± SEM, n = 4, technical replicates; ∗∗p < 0.01, ∗∗∗∗p < 0.0001, unpaired t test). (H) Flow cytometry showing the percentage of day-4 hPGCLCs induced from control, IGF2BP1-KO, IGF2BP1-KO+IGF2BP1-OE, and IGF2BP1-KO+IGF2BP1-trunc-OE hESCs (mean ± SEM, n = 3, biological replicates; n.s., not significant, ∗∗∗p < 0.001, unpaired t test). See also Figure S4 and Table S3 |
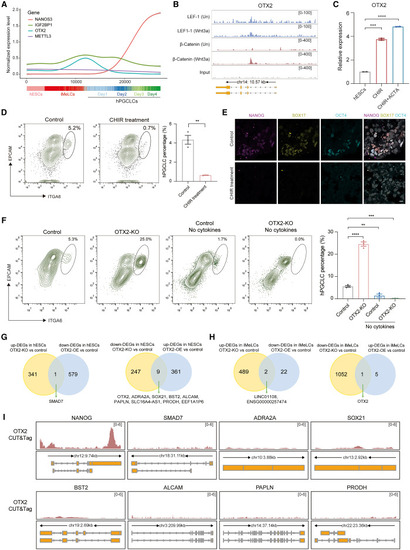
The regulation of OTX2 expression during hPGCLC induction (A) Pseudotime curves showing the expression patterns of NANOS3, IGF2BP1, OTX2, and METTL3 in single cells from germline trajectory based on the single-cell RNA sequencing (scRNA-seq) of hESCs, iMeLCs, and day 1–4 hPGCLC aggregates. (B) Tracks showing the binding of LEF1 and β-catenin around the genomic region of OTX2 from ChIP-seq of LEF1 and β-catenin in hESCs. Un: untreated. (C) qPCR showing the expression of OTX2 in hESCs, hESCs treated with CHIR99021 (CHIR), and hESCs treated with CHIR and ACTIVIN A (ACTA) (mean ± SEM, n = 2, technical replicates; ∗∗∗p < 0.001, ∗∗∗∗p < 0.0001, unpaired t test). (D) Flow cytometry showing the percentage of day-4 hPGCLCs induced from control and CHIR-treated cells (mean ± SEM, n = 3, biological replicates; ∗∗p < 0.01, unpaired t test). (E) Immunofluorescence of NANOG (magenta), SOX17 (yellow), and OCT4 (cyan) for day-4 hPGCLC aggregates induced from control and CHIR-treated hESCs. DAPI (gray) is counterstained for nuclei. Scale bar: 10 μm. (F) Flow cytometry showing the percentage of day-4 hPGCLCs induced from control with cytokines, OTX2-KO with cytokines, control without cytokines, and OTX2-KO without cytokines (mean ± SEM, n = 3, biological replicates; ∗∗p < 0.01, ∗∗∗p < 0.001, ∗∗∗∗p < 0.0001, unpaired t test). (G) Overlap of upregulated DEGs in OTX2-KO hESCs with downregulated DEGs in OTX2-OE hESCs; and overlap of downregulated DEGs in OTX2-KO hESCs with upregulated DEGs in OTX2-OE hESCs. (H) Overlap of upregulated DEGs in OTX2-KO iMeLCs with downregulated DEGs in OTX2-OE iMeLCs and overlap of downregulated DEGs in OTX2-KO iMeLCs with upregulated DEGs in OTX2-OE iMeLCs. (I) Tracks showing the binding of OTX2 for overlapped genes from Figures 5G and 5H based on the CUT&Tag of OTX2 in iMeLCs. See also Figure S5 and Table S4. |
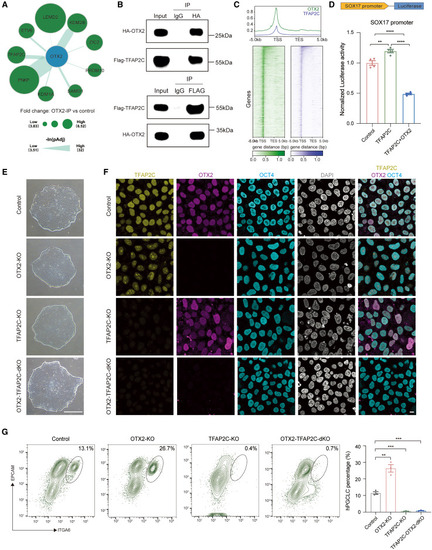
OTX2 antagonizes TFAP2C for restricting human germ cell fate (A) Bubble plot showing the interacting proteins for OTX2 based on IP-MS of OTX2 in hESCs. (B) Reciprocal coimmunoprecipitation (coIP) experiments showing the physical interaction between OTX2 and TFAP2C. (C) Metaplots showing the binding of OTX2 and TFAP2C in genomic regions. (D) Luciferase assay detecting the effects of TFAP2C and OTX2 on the promoter of SOX17 (mean ± SEM, n = 4, technical replicates; ∗∗p < 0.01, ∗∗∗∗p < 0.0001, unpaired t test). (E) Phase contrast images showing the morphology of control, OTX2-KO, TFAP2C-KO, and OTX2-TFAP2C-dKO hESCs. Scale bar: 200 μm. (F) Immunofluorescence for TFAP2C (yellow), OTX2 (magenta), OCT4 (cyan), and DAPI (gray) in control, OTX2-KO, TFAP2C-KO, and OTX2-TFAP2C-dKO hESCs. Scale bar: 10 μm. (G) Flow cytometry showing the percentage of day-4 hPGCLCs induced from control, OTX2-KO, TFAP2C-KO, and OTX2-TFAP2C-dKO hESCs (mean ± SEM, n = 3, biological replicates; ∗∗p < 0.01, ∗∗∗p < 0.001, unpaired t test). See also Figure S6 and Tables S5 and S7. |
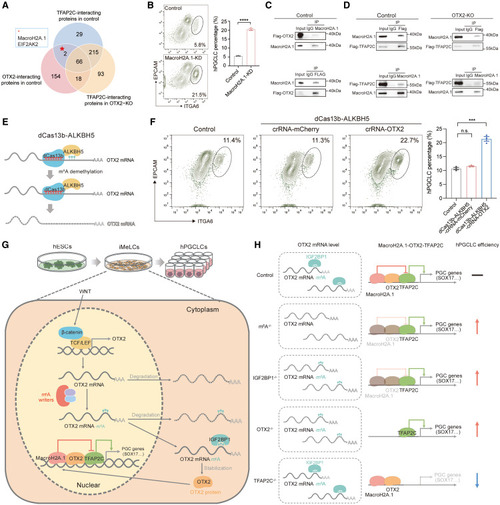
m6A-OTX2-MacroH2A.1-TFAP2C axis for restricting the entry of human germ cell lineage (A) Venn diagram showing the overlapped proteins that interacted with TFAP2C in control hESCs, interacted with OTX2 in control hESCs, but did not interact with TFAP2C in OTX2-KO hESCs. (B) Flow cytometry showing the percentage of day-4 hPGCLCs induced from control and MacroH2A.1-KD hESCs (mean ± SEM, n = 3, biological replicates; ∗∗∗∗p < 0.001, unpaired t test). (C) Reciprocal coIP experiments showing the physical interaction between OTX2 and MacroH2A.1 in hESCs. (D) Reciprocal coIP experiments showing the physical interactions between TFAP2C and MacroH2A.1 in control and OTX2-KO hESCs. (E) Schematic illustration of removing m6A modifications on OTX2-3’UTR by overexpressing dCas13b-ALKBH5 and crRNAs targeting OTX2-3’UTR (dCas13b-ALKBH5-crRNA-OTX2). (F) Flow cytometry showing the percentage of day-4 hPGCLCs induced from control, dCas13b-ALKBH5 with crRNAs targeting mCherry (dCas13b-ALKBH5-crRNA-mCherry), and dCas13b-ALKBH5-crRNA-OTX2 (mean ± SEM, n = 3, biological replicates; n.s., not significant, ∗∗∗p < 0.001, unpaired t test). (G and H) Models showing the axis of m6A-IGF2BP1-OTX2-MacroH2A.1-TFAP2C and the corresponding phenotypes when this pathway is impaired. See also Figure S7. |