
Fig. 5
- ID
- ZDB-FIG-250728-112
- Publication
- Zhang et al., 2025 - IGF2BP1 restricts the induction of human primordial germ cell fate in an m6A-dependent manner
- Other Figures
- All Figure Page
- Back to All Figure Page
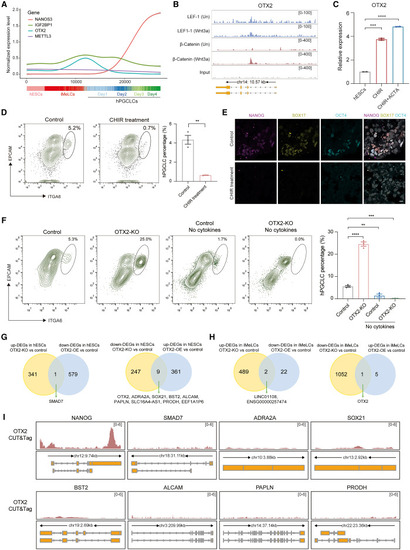
The regulation of OTX2 expression during hPGCLC induction (A) Pseudotime curves showing the expression patterns of NANOS3, IGF2BP1, OTX2, and METTL3 in single cells from germline trajectory based on the single-cell RNA sequencing (scRNA-seq) of hESCs, iMeLCs, and day 1–4 hPGCLC aggregates. (B) Tracks showing the binding of LEF1 and β-catenin around the genomic region of OTX2 from ChIP-seq of LEF1 and β-catenin in hESCs. Un: untreated. (C) qPCR showing the expression of OTX2 in hESCs, hESCs treated with CHIR99021 (CHIR), and hESCs treated with CHIR and ACTIVIN A (ACTA) (mean ± SEM, n = 2, technical replicates; ∗∗∗p < 0.001, ∗∗∗∗p < 0.0001, unpaired t test). (D) Flow cytometry showing the percentage of day-4 hPGCLCs induced from control and CHIR-treated cells (mean ± SEM, n = 3, biological replicates; ∗∗p < 0.01, unpaired t test). (E) Immunofluorescence of NANOG (magenta), SOX17 (yellow), and OCT4 (cyan) for day-4 hPGCLC aggregates induced from control and CHIR-treated hESCs. DAPI (gray) is counterstained for nuclei. Scale bar: 10 μm. (F) Flow cytometry showing the percentage of day-4 hPGCLCs induced from control with cytokines, OTX2-KO with cytokines, control without cytokines, and OTX2-KO without cytokines (mean ± SEM, n = 3, biological replicates; ∗∗p < 0.01, ∗∗∗p < 0.001, ∗∗∗∗p < 0.0001, unpaired t test). (G) Overlap of upregulated DEGs in OTX2-KO hESCs with downregulated DEGs in OTX2-OE hESCs; and overlap of downregulated DEGs in OTX2-KO hESCs with upregulated DEGs in OTX2-OE hESCs. (H) Overlap of upregulated DEGs in OTX2-KO iMeLCs with downregulated DEGs in OTX2-OE iMeLCs and overlap of downregulated DEGs in OTX2-KO iMeLCs with upregulated DEGs in OTX2-OE iMeLCs. (I) Tracks showing the binding of OTX2 for overlapped genes from Figures 5G and 5H based on the CUT&Tag of OTX2 in iMeLCs. See also Figure S5 and Table S4. |