
|
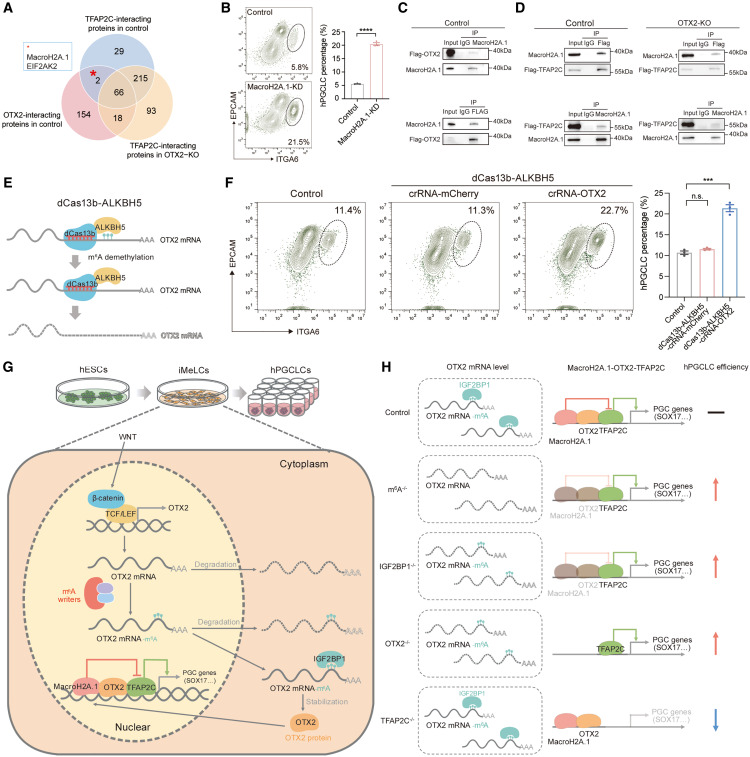
Fig. 7 m6A-OTX2-MacroH2A.1-TFAP2C axis for restricting the entry of human germ cell lineage (A) Venn diagram showing the overlapped proteins that interacted with TFAP2C in control hESCs, interacted with OTX2 in control hESCs, but did not interact with TFAP2C in OTX2-KO hESCs. (B) Flow cytometry showing the percentage of day-4 hPGCLCs induced from control and MacroH2A.1-KD hESCs (mean ± SEM, n = 3, biological replicates; ∗∗∗∗p < 0.001, unpaired t test). (C) Reciprocal coIP experiments showing the physical interaction between OTX2 and MacroH2A.1 in hESCs. (D) Reciprocal coIP experiments showing the physical interactions between TFAP2C and MacroH2A.1 in control and OTX2-KO hESCs. (E) Schematic illustration of removing m6A modifications on OTX2-3’UTR by overexpressing dCas13b-ALKBH5 and crRNAs targeting OTX2-3’UTR (dCas13b-ALKBH5-crRNA-OTX2). (F) Flow cytometry showing the percentage of day-4 hPGCLCs induced from control, dCas13b-ALKBH5 with crRNAs targeting mCherry (dCas13b-ALKBH5-crRNA-mCherry), and dCas13b-ALKBH5-crRNA-OTX2 (mean ± SEM, n = 3, biological replicates; n.s., not significant, ∗∗∗p < 0.001, unpaired t test). (G and H) Models showing the axis of m6A-IGF2BP1-OTX2-MacroH2A.1-TFAP2C and the corresponding phenotypes when this pathway is impaired. See also Figure S7.