
Fig. 3
- ID
- ZDB-FIG-250728-110
- Publication
- Zhang et al., 2025 - IGF2BP1 restricts the induction of human primordial germ cell fate in an m6A-dependent manner
- Other Figures
- All Figure Page
- Back to All Figure Page
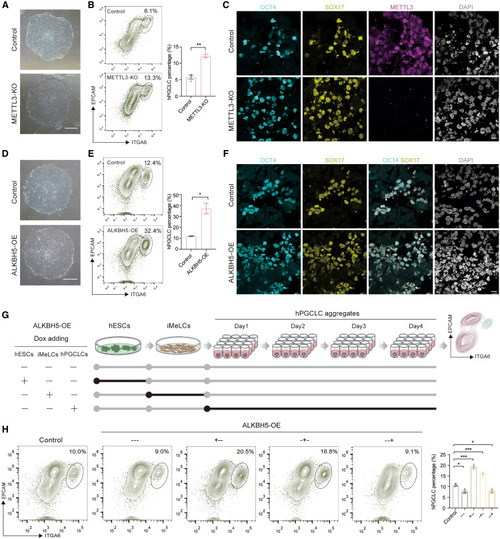
m6A modifications are involved in hPGCLC induction from hESCs (A) Phase contrast images showing the morphology of control and METTL3-KO hESCs. Scale bar: 200 μm. (B) Flow cytometry showing the percentage of day-4 hPGCLCs induced from control and METTL3-KO hESCs (mean ± SEM, n = 3, biological replicates; ∗∗p < 0.01, unpaired t test). (C) Immunofluorescence for OCT4 (cyan), SOX17 (yellow), and METTL3 (magenta) for day-4 hPGCLC aggregates induced from control and METTL3-KO hESCs. DAPI (gray) is counterstained for nuclei. Scale bar: 10 μm. (D) Phase contrast images showing the morphology of control and ALKBH5-OE hESCs. Scale bar: 200 μm. (E) Flow cytometry showing the percentage of day-4 hPGCLCs induced from control and ALKBH5-OE hESCs (mean ± SEM, n = 2, biological replicates; ∗p < 0.05, unpaired t test). (F) Immunofluorescence for OCT4 (cyan) and SOX17 (yellow) for day-4 hPGCLC aggregates induced from control and ALKBH5-OE hESCs. DAPI (gray) is counterstained for nuclei. Scale bar: 10 μm. (G) Schematic illustration showing the design for overexpressing ALKBH5 at different stages of hPGCLC induction. (H) Flow cytometry showing the percentage of day-4 hPGCLCs induced from hESCs with ALKBH5-OE at different stages during hPGCLC induction (mean ± SEM, n = 3, biological replicates; ∗p < 0.05, ∗∗∗p < 0.001, unpaired t test). See also Figure S3. |