
Fig. 2
- ID
- ZDB-FIG-250728-109
- Publication
- Zhang et al., 2025 - IGF2BP1 restricts the induction of human primordial germ cell fate in an m6A-dependent manner
- Other Figures
- All Figure Page
- Back to All Figure Page
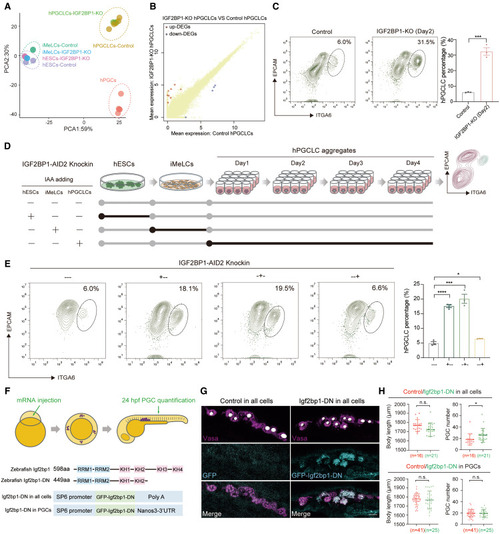
IGF2BP1 is involved in the regulation of hESC to hPGCLC induction (A) PCA plot showing the transcriptomes of control and IGF2BP1-KO hESCs, iMeLCs, day-4 hPGCLCs, and embryonic hPGCs. (B) DEGs of IGF2BP1-KO day-4 hPGCLCs compared with control day-4 hPGCLCs. p value < 0.05. (C) Flow cytometry showing the percentage of day-2 hPGCLCs induced from control and IGF2BP1-KO hESCs (mean ± SEM, n = 3, biological replicates; ∗∗∗p < 0.001, unpaired t test). (D) Schematic illustration showing the design for adding IAA to IGF2BP1-AID2-knockin cells at different stages of hPGCLC induction. (E) Flow cytometry showing the percentage of day-4 hPGCLCs induced from hESCs with IAA added at different stages during hPGCLC induction (mean ± SEM, n = 3, biological replicates; ∗p < 0.05, ∗∗∗p < 0.001, ∗∗∗∗p < 0.0001, unpaired t test). (F) Schematic illustration of experimental design for overexpressing wild-type or dominant negative (DN) forms of Igf2bp1 in all cells or in PGCs only. (G) Immunofluorescence for Vasa (magenta) and GFP (gray) for quantification of PGCs. Scale bar: 10 μm. (H) Quantification of body length and PGC numbers with overexpression of Igf2bp1 (control) and Igf2bp1-DN in all cells and in PGCs. n, Number of PGCs (mean ± SEM, biological replicates; n.s., not significant, ∗p < 0.05, unpaired t test). See also Figure S2 and Table S2. |