
|
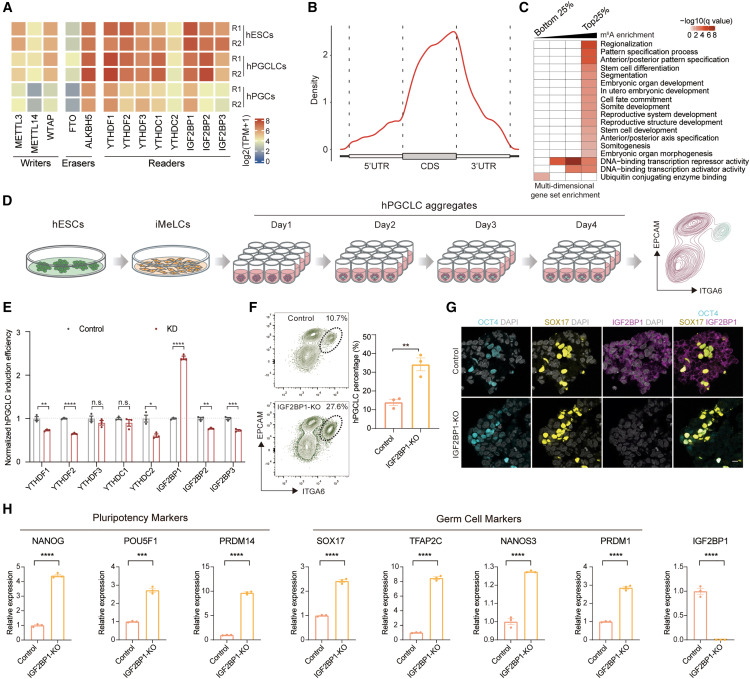
Fig. 1 The m6A reader IGF2BP1 suppresses hPGCLCs induced from hESCs (A) Expression levels of m6A writers, erasers, and readers in hESCs, hPGCLCs, and hPGCs. (B) Enrichment of m6A modifications across mRNA transcriptome in hESCs. CDS: coding sequence. UTR: untranslated regions. (C) Heatmap showing gene set enrichment analysis for m6A-modified genes in hESCs. (D) Illustration of hESC to hPGCLC differentiation strategy. (E) Normalized hPGCLC induction efficiency for CRISPRi screening the m6A readers (mean ± SEM, n = 3, biological replicates; n.s., not significant, ∗p < 0.05, ∗∗p < 0.01, ∗∗∗p < 0.001, ∗∗∗∗p < 0.0001, unpaired t test). (F) Flow cytometry showing the percentage of day-4 hPGCLCs induced from control and IGF2BP1-KO hESCs (mean ± SEM, n = 3, biological replicates; ∗∗p < 0.01, unpaired t test). (G) Immunofluorescence for OCT4 (cyan), SOX17 (yellow), and IGF2BP1 (magenta) for day-4 hPGCLC aggregates induced from control and IGF2BP1-KO hESCs. DAPI (gray) is counterstained for nuclei. Scale bar: 10 μm. (H) qPCR showing the expression of pluripotency and germ cell markers in control and IGF2BP1-KO day-4 hPGCLC aggregates (mean ± SEM, n = 3, technical replicates; ∗∗∗p < 0.001, ∗∗∗∗p < 0.0001, unpaired t test). See also Figure S1 and Tables S1 and S7.