
|
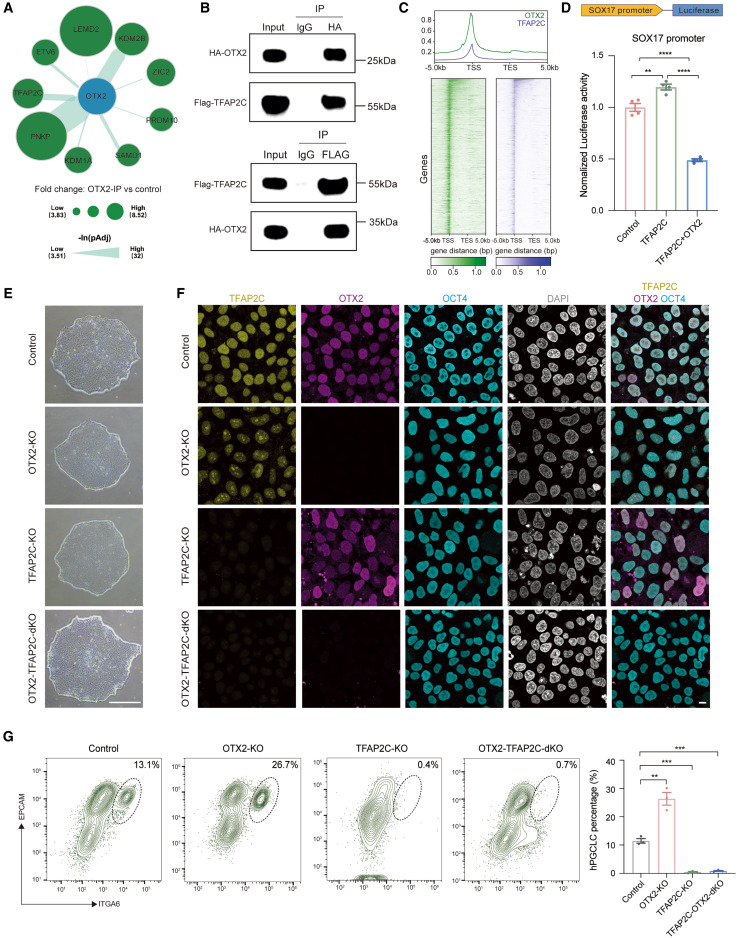
Fig. 6 OTX2 antagonizes TFAP2C for restricting human germ cell fate (A) Bubble plot showing the interacting proteins for OTX2 based on IP-MS of OTX2 in hESCs. (B) Reciprocal coimmunoprecipitation (coIP) experiments showing the physical interaction between OTX2 and TFAP2C. (C) Metaplots showing the binding of OTX2 and TFAP2C in genomic regions. (D) Luciferase assay detecting the effects of TFAP2C and OTX2 on the promoter of SOX17 (mean ± SEM, n = 4, technical replicates; ∗∗p < 0.01, ∗∗∗∗p < 0.0001, unpaired t test). (E) Phase contrast images showing the morphology of control, OTX2-KO, TFAP2C-KO, and OTX2-TFAP2C-dKO hESCs. Scale bar: 200 μm. (F) Immunofluorescence for TFAP2C (yellow), OTX2 (magenta), OCT4 (cyan), and DAPI (gray) in control, OTX2-KO, TFAP2C-KO, and OTX2-TFAP2C-dKO hESCs. Scale bar: 10 μm. (G) Flow cytometry showing the percentage of day-4 hPGCLCs induced from control, OTX2-KO, TFAP2C-KO, and OTX2-TFAP2C-dKO hESCs (mean ± SEM, n = 3, biological replicates; ∗∗p < 0.01, ∗∗∗p < 0.001, unpaired t test). See also Figure S6 and Tables S5 and S7.