
- Title
-
FOXK2 in skeletal muscle development: a new pathogenic gene for congenital myopathy with ptosis
- Authors
- Wu, P., Song, N., Xiang, Y., Tao, Z., Mao, B., Guo, R., Wang, X., Wu, D., Zhang, Z., Chen, X., Ma, D., Zhang, T., Hao, B., Ma, J.
- Source
- Full text @ EMBO Mol. Med.
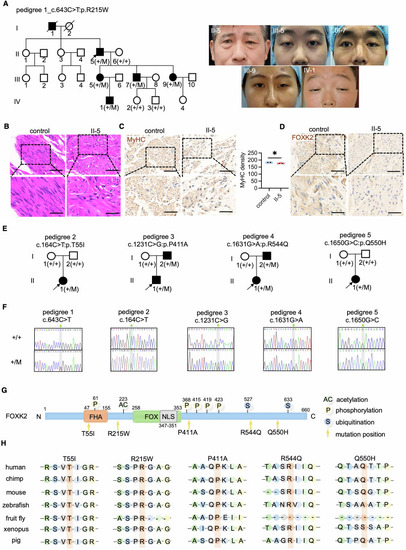
Identification of ( |
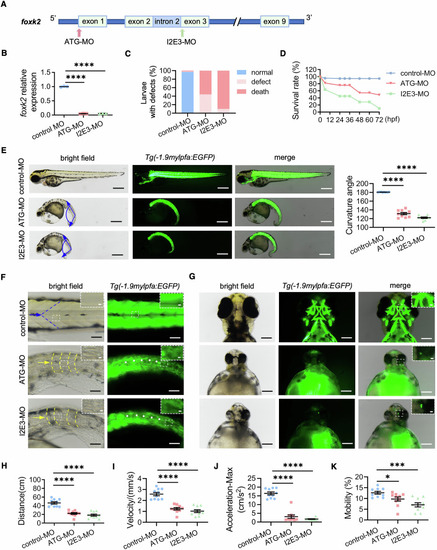
foxk2 knockdown impaired skeletal muscle development of zebrafish. ( |
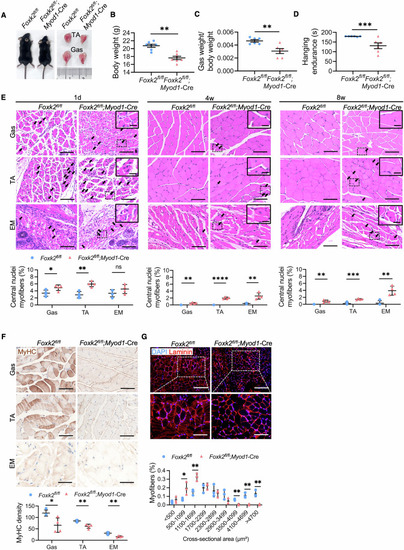
( |
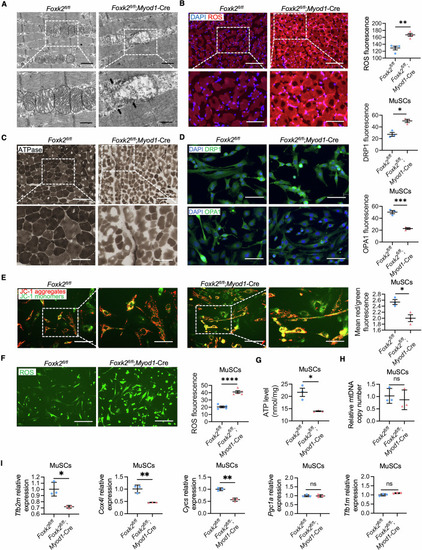
Defective mitochondrial functions in FOXK2 deficiency models. ( |
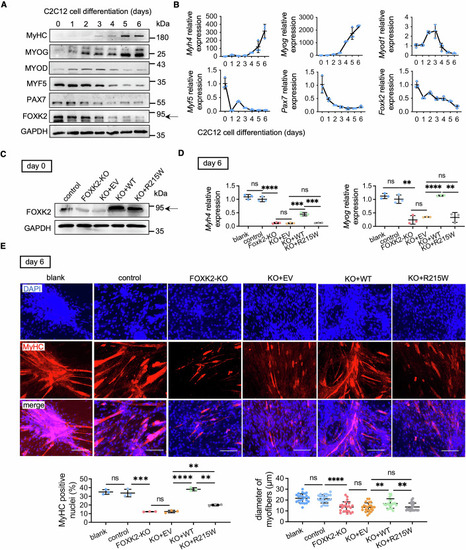
Impaired myogenic differentiation by FOXK2 deficiency and ineffective rescue of R215W mutant in C2C12 cells. ( |
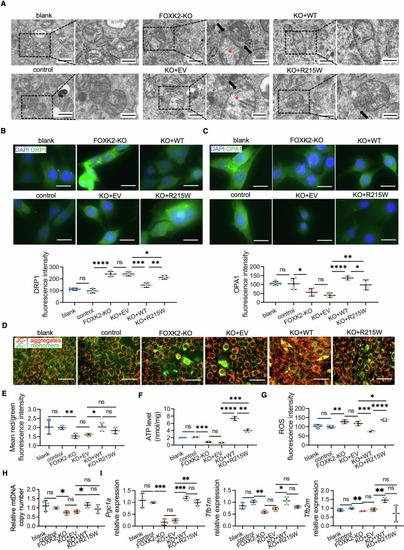
Mitochondrial dyshomeostasis by FOXK2 deficiency and low-effective rescue of R215W mutant in C2C12 cells. ( |
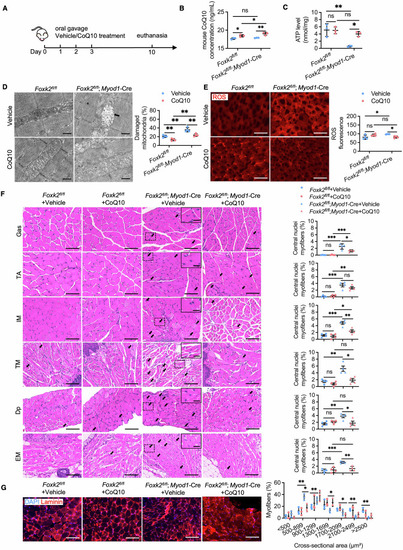
Coenzyme Q10 improves mitochondrial dysfunction and skeletal muscle development disorders of mice with ( |
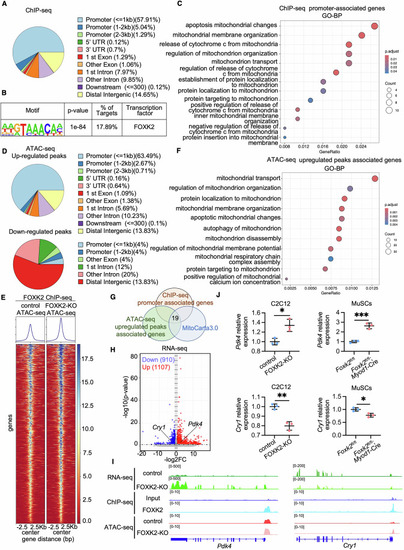
FOXK2 transcriptional regulation in C2C12 Cells. ( |