|
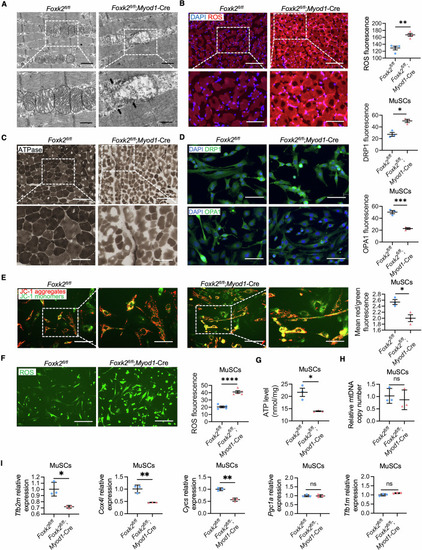
Defective mitochondrial functions in FOXK2 deficiency models. (A) Representative TEM images in TA sections of Foxk2fl/fl and Foxk2fl/fl; Myod1-Cre littermates at 8 weeks. Black arrows point to the damaged mitochondria. The image below (scale bars: 1 µm) is an enlarged view of the white box in the image above (scale bars: 2 µm). (B) ROS production in TA sections of Foxk2fl/fl and Foxk2fl/fl; Myod1-Cre littermates at 8 weeks by DHE staining (n = 4 areas). The image below (scale bars: 100 µm) is an enlarged view of the white box in the image above (scale bars: 200 µm). P value: **P = 0.0014. (C) ATPase activity detection in TA sections of Foxk2fl/fl and Foxk2fl/fl; Myod1-Cre littermates at 8 weeks. The image below (scale bars: 100 µm) is an enlarged view of the white box in the image above (scale bars: 200 µm). (D) DRP1 and OPA1 IF staining of MuSCs from Foxk2fl/fl and Foxk2fl/fl; Myod1-Cre littermates with fluorescence quantitative statistics shown on the right (n = 3 areas). Scale bars: 100 µm. P value: DRP1, *P = 0.0119; OPA1, ***P = 0.0009. (E) Representative images of MuSCs from Foxk2fl/fl and Foxk2fl/fl; Myod1-Cre littermates by JC-1 staining. The zoomed-in area (scale bars: 100 µm) is an enlarged view of the boxed area in the image (scale bars: 200 µm). The red/green ratio fluorescence quantitative statistics to measure mitochondrial membrane potential are shown on the right (n = 3 areas). P value: *P = 0.0193. (F) Representative images of MuSCs (scale bars: 200 µm) and quantitative of fluorescence intensity to measure ROS levels in MuSCs from Foxk2fl/fl and Foxk2fl/fl; Myod1-Cre littermates by DCFH-DA staining (n = 5 areas). P value: ****P < 0.0001. (G) Quantification of the ATP content in MuSCs from Foxk2fl/fl and Foxk2fl/fl; Myod1-Cre littermates (n = 3 repeats). The values were normalized to the total cellular protein level. P value: *P = 0.0105. (H) Quantitative of mitochondrial DNA copy number in MuSCs from Foxk2fl/fl and Foxk2fl/fl; Myod1-Cre littermates by qPCR (n = 3 repeats). P value: ns-P = 0.6130. (I) Quantitative of relative mitochondrial genes expression levels in MuSCs from Foxk2fl/fl and Foxk2fl/fl; Myod1-Cre littermates by qPCR (n = 3 repeats). P value: Tfb2m, *P = 0.0125; Cox4l, **P = 0.0039; Cycs, **P = 0.0011; Pgc1a, ns-P = 0.8299; Tfb1m, ns-P = 0.0608. Data were analyzed by Student’s t test. All error bars indicate mean ± standard deviation. TEM transmission electron microscopy, ROS reactive oxygen species, TA tibialis anterior, DHE dihydroethidium, IF immunofluorescence, MuSCs muscle stem cells, DCFH-DA dichlorodihydrofluorescein diacetate, qPCR quantitative real-time polymerase chain reaction. Source data are available online for this figure.
|