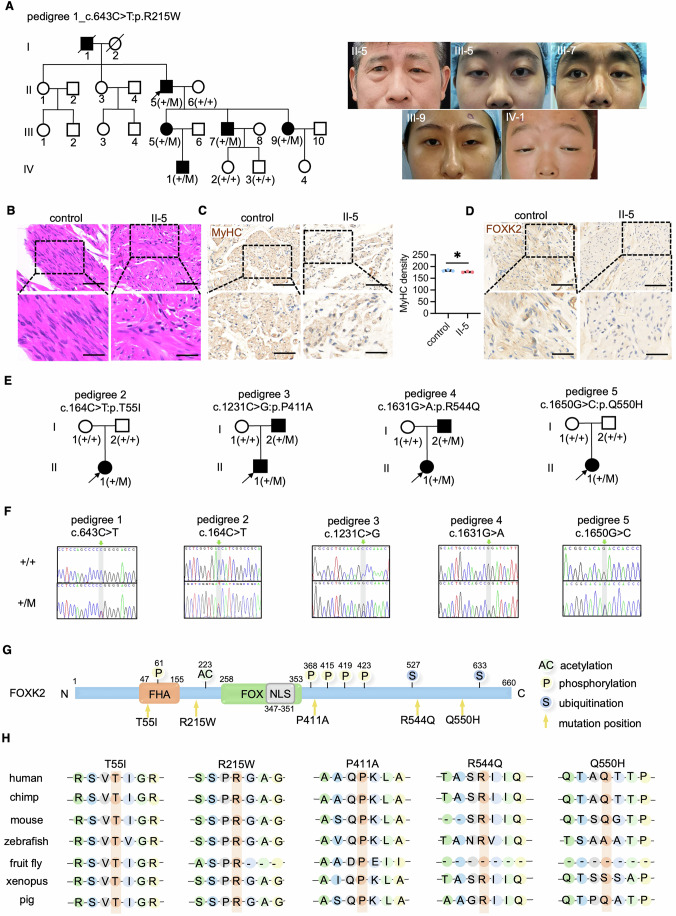
IMAGE

Figure 1

ID
ZDB-IMAGE-250714-90
Source
Figures for Wu et al., 2025
Image
Figure Caption

Figure 1 Identification of FOXK2 mutations in pedigrees of congenital ptosis and associated myopathy.

(A) Pedigree illustrating isolated congenital ptosis with a heterozygous FOXK2 mutation (c.643 C > T:p.R215W). Photographs of affected individuals are included. Black-filled symbols denote affected members. ‘+’ indicates the wild-type FOXK2 allele, while ‘M’ represents the mutated allele. The black arrow points to the proband. Genotypes of some individuals remain unspecified due to the unavailability of genomic DNA. (B) H&E staining of eyelid muscle tissues from a control individual and the proband (II-5) in the pedigree described in (A). The zoomed area (scale bars: 50 µm) provides an enlarged view of the boxed region in the left image (scale bars: 100 µm). (C) IHC staining of MyHC in the eyelid muscle samples of a control individual and the proband (II-5) in the pedigree described in (A) (n = 3 area per group). The zoomed area (scale bars: 50 µm) offers an enlarged view of the boxed region in the left image (scale bars: 100 µm). Quantitative analysis was performed using ImageJ software, with results expressed by InDen/Area. P value: *P = 0.0448. (D) IHC staining of FOXK2 in the eyelid muscle samples of a control individual and the proband (II-5) in the pedigree described in (A). The zoomed area (scale bars: 50 µm) offers an enlarged view of the boxed region in the left image (scale bars: 100 µm). (E) Pedigrees depicting congenital myopathy associated with ptosis, carrying various heterozygous FOXK2 mutations (c.164 C > T:p.T55I; c.1231 C > G:p.P411A; c.1631 G > A:p.R544Q; c.1650 G > C:p.Q550H). ‘+’ denotes the wild-type FOXK2 allele, and ‘M’ represents the mutated allele. The black arrow identifies the proband. (F) Sanger sequencing diagrams of the FOXK2 mutation sites in healthy individuals and patients across five pedigrees. Green arrows in the upper panels indicate the mutation sites, highlighted in gray. (G) Diagram of the FOXK2 protein showing the locations of the mutations. (H) Species conservation analysis of FOXK2 amino acids p.T55, p.R215, p.P411, p.R544, and p.Q550. Data were analyzed by Student’s t test. All error bars represent mean ± standard deviation. H&E hematoxylin-eosin staining, FHA forkhead-associated domain, FOX forkhead DNA-binding domain, NLS nuclear localization sequence, IHC immunohistochemistry. Source data are available online for this figure.

Acknowledgments
This image is the copyrighted work of the attributed author or publisher, and ZFIN has permission only to display this image to its users. Additional permissions should be obtained from the applicable author or publisher of the image. Full text @ EMBO Mol. Med.