|
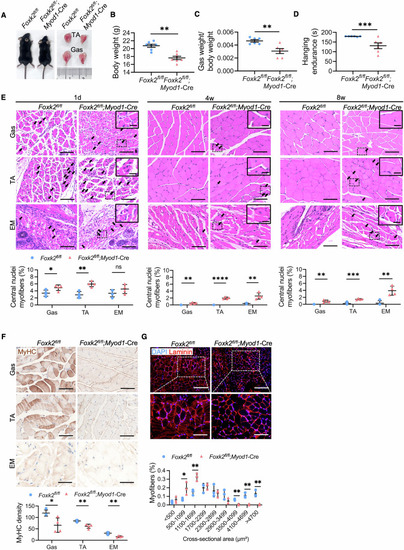
Foxk2 deficiency in muscle stem cells results in skeletal muscle dysplasia in mice. (A) Representative images of Foxk2fl/fl and Foxk2fl/fl; Myod1-Cre littermates at 8 weeks, including their TA and Gas muscle. (B) Body weight of Foxk2fl/fl and Foxk2fl/fl; Myod1-Cre mice at 8 weeks (n = 7 mice for each group). P value: **P = 0.0020. (C) Ratio of Gas muscle weight to body weight in Foxk2fl/fl and Foxk2fl/fl; Myod1-Cre mice at 8 weeks (n = 6 mice for each group). P value: **P = 0.0047. (D) Hanging endurance time measured by the hanging endurance test in Foxk2fl/fl and Foxk2fl/fl; Myod1-Cre mice at 8 weeks (n = 6 mice for each group). P value: ***P = 0.0003. (E) H&E staining illustrating histological aspects and the percentage of central nuclei myofibers in skeletal muscles (Gas, TA, and EM) of Foxk2fl/fl and Foxk2fl/fl; Myod1-Cre littermates at postnatal 1 day, 4 weeks, and 8 weeks (n = 4 areas). Black arrows indicate central nuclei. The inset in the upper right corner (scale bars: 25 µm) is an enlarged view of the boxed area in the main image (scale bars: 100 µm), highlighting central nuclei myofibers. P value: 1 d: Gas, *P = 0.0389; TA, **P = 0.0019; EM, ns-P = 0.1708. 4w: Gas, **P = 0.0017; TA, ****P < 0.0001; EM, **P = 0.0031. 8w: Gas, **P = 0.0030; TA, ***P = 0.0006; EM, **P = 0.0026. (F) IHC staining of MyHC in the skeletal muscles (Gas, TA, and EM) of Foxk2fl/fl and Foxk2fl/fl; Myod1-Cre littermates at 8 weeks (n = 4 areas). MyHC was quantified by InDen/Area using ImageJ software. Scale bars: 100 µm for Gas and TA; 50 µm for EM. P value: Gas, *P = 0.0212; TA, **P = 0.0033; EM, **P = 0.0029. (G) IF staining of Laminin was the TA of Foxk2fl/fl and Foxk2fl/fl; Myod1-Cre littermates at 8 weeks. The distribution of cross-sectional area of myofibers was calculated (n = 3 areas). The zoomed area (scale bars: 100 µm) is an enlarged view of the boxed area in the main image (scale bars: 200 µm). P value: 500-1099, *P = 0.0401; 1100-1699, **P = 0.0049; 3500-4099, **P = 0.0014; 4100-4699, **P = 0.0041; >4700, **P = 0.0047. Data were analyzed by Student’s t test. All error bars indicate mean ± standard deviation. TA tibialis anterior, Gas gastrocnemius, d day, w week, EM eyelid muscle, H&E hematoxylin-eosin staining, IHC immunohistochemistry, IF immunofluorescence. Source data are available online for this figure.
|