IMAGE

Figure 5

ID
ZDB-IMAGE-250714-94
Source
Figures for Wu et al., 2025
Image
Figure Caption

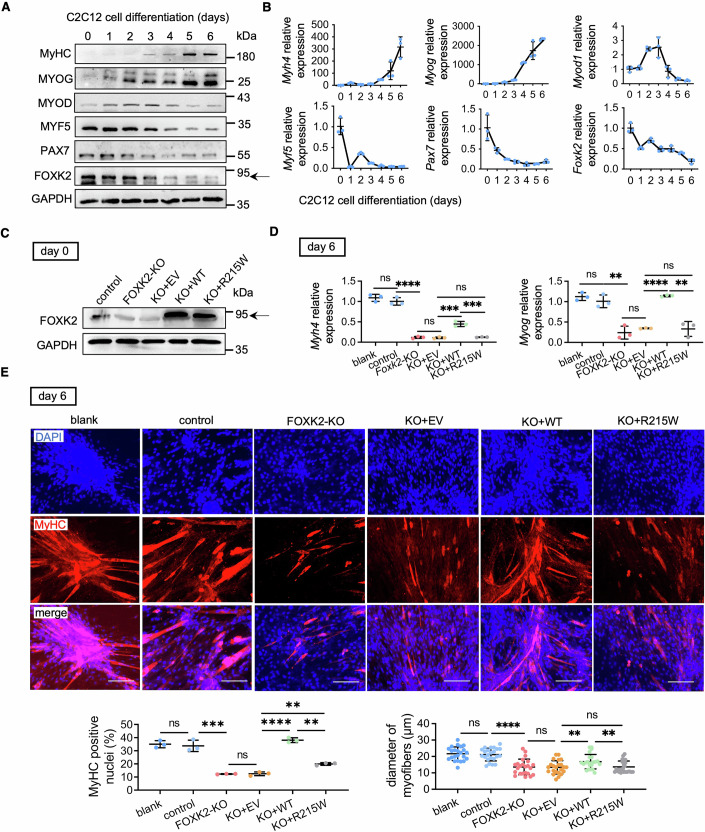
Figure 5 Impaired myogenic differentiation by FOXK2 deficiency and ineffective rescue of R215W mutant in C2C12 cells.

(A, B) (A)Western blot and (B) qPCR analysis (n = 3 repeats) of MyHC, MYOG, MYOD, MYF5, PAX7 and FOXK2 expression levels in C2C12 cells. Cells were induced into myogenic differentiation and whole cell lysates were isolated at the indicated times for analysis. The black arrow points to the specific protein band. (C) Western blot analysis of FOXK2 expression level in C2C12 cells at undifferentiated stage (day 0). The black arrow points to the specific protein band. (D) Quantitative analysis of Myh4 and Myog expression levels by qPCR after 6-day myogenic differentiation (n = 3 repeats). P value for blank vs control, control vs FOXK2-KO, FOXK2-KO vs KO + EV, KO + EV vs KO + WT, KO + WT vs KO + R215W and KO + EV vs KO + R215W: Myh4: ns-P = 0.2985; ****P < 0.0001; ns-P = 0.7651; ***P = 0.0009; ***P = 0.0009; ns-P = 0.2905. Myog: ns-P = 0.3348; **P = 0.0040; ns-P = 0.3182; ****P < 0.0001; **P = 0.0015; ns-P = 0.8951. (E) Representative images of MyHC (red) and DAPI (blue) IF staining in C2C12 cells after 6-day myogenic differentiation (scale bars: 200 µm area). The percentage of MyHC-positive nuclei (n = 3 areas) and the diameter of myofibers (n = 23 myofibers) are shown below. P value for blank vs control, control vs FOXK2-KO, FOXK2-KO vs KO + EV, KO + EV vs KO + WT, KO + WT vs KO + R215W and KO + EV vs KO + R215W: Left: ns-P = 0.6887; ***P = 0.0010; ns-P = 0.8348; ****P < 0.0001; **P = 0.0010; **P = 0.0018. Right: ns-P = 0.7009; ****P < 0.0001; ns-P = 0.8594; **P = 0.0070; **P = 0.0081; ns-P = 0.8277. Data were analyzed by Student’s t test. All error bars indicate mean ± standard deviation. Blank untreated wild-type C2C12 cells, control C2C12 cells transfected with a blank vector as a control for the FOXK2-KO group, FOXK2-KO FOXK2 knockout C2C12 cells, KO + EV FOXK2-KO cells transfected with a blank vector as a control for KO + WT and KO + R215W groups, KO + WT FOXK2-KO cells with overexpression of the human wild-type FOXK2 vector, KO + R215W FOXK2-KO cells with overexpression of the human FOXK2 R215W mutation vector, qPCR quantitative real-time polymerase chain reaction, IF immunofluorescence. Source data are available online for this figure.

Acknowledgments
This image is the copyrighted work of the attributed author or publisher, and ZFIN has permission only to display this image to its users. Additional permissions should be obtained from the applicable author or publisher of the image. Full text @ EMBO Mol. Med.