|
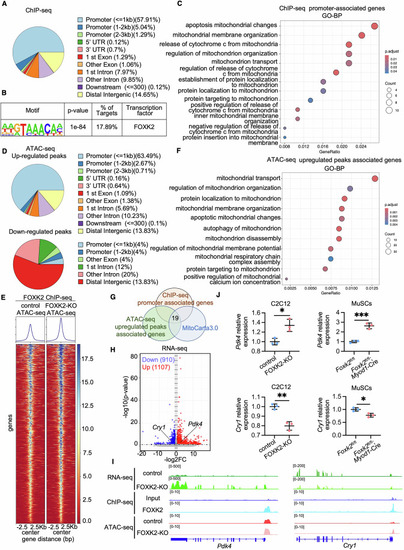
FOXK2 transcriptional regulation in C2C12 Cells. (A) Genome-wide distribution of FOXK2 binding sites identified by ChIP-seq in C2C12 cells. (B) Enriched motif at FOXK2 binding sites identified by ChIP-seq. (C) GO analysis (BP) of genes with promoter regions bound by FOXK2, with a focus on mitochondrion-related terms. (D) Genome-wide distribution of FOXK2-binding peaks with altered chromatin accessibility in FOXK2-KO C2C12 cells, as determined by ATAC-seq. (E) Heatmap showing changes in chromatin accessibility changes at FOXK2 binding sites in FOXK2-KO C2C12 cells. (F) GO analysis (BP) of genes with upregulated chromatin accessibility in FOXK2-KO C2C12 cells, highlighting mitochondrion-related terms. (G) Venn diagrams show the overlapping (19 genes) among genes FOXK2-bound promoters (ChIP-seq), upregulated chromatin accessibility (ATAC-seq), and mitochondrion-related genes from the MitoCarta 3.0 database. (H) Volcano plot of DEGs (Down: 910 genes; Up: 1107 genes) from RNA-seq, with genes showing |log2FC| > 0.58 and p-value < 0.05. (I) Normalized RNA-seq, ChIP-seq and ATAC-seq profiles at the Pdk4 and Cry1 loci in FOXK2-KO vs. control cells. (J) Quantitative of relative Pdk4 and Cry1 mRNA expression levels in C2C12 cells and MuSCs from Foxk2fl/fl and Foxk2fl/fl; Myod1-Cre mice, assessed by qPCR (n = 3 repeats). P value: C2C12: Pdk4, *P = 0.0154; Cry1, **P = 0.0027. MuSCs: Pdk4, ***P = 0.0010; Cry1, *P = 0.0176. Data were analyzed by Student’s t test. All error bars represent mean ± standard deviation. MuSCs muscle stem cells, ChIP-seq chromatin immunoprecipitation sequencing, GO Gene Ontology, BP biological process, control C2C12 cells transfected with a blank vector as a control for the FOXK2-KO group, FOXK2-KO FOXK2 knockout C2C12 cells, ATAC-seq assay of transposase accessible chromatin sequencing, RNA-seq RNA sequencing, DEGs differentially expressed genes, FC fold change, qPCR quantitative real-time polymerase chain reaction. Source data are available online for this figure.
|