|
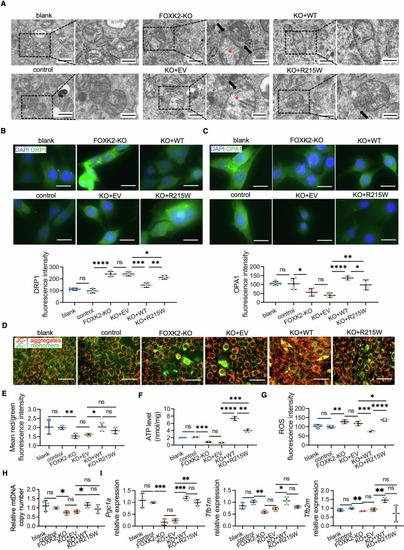
Mitochondrial dyshomeostasis by FOXK2 deficiency and low-effective rescue of R215W mutant in C2C12 cells. (A) Representative TEM images of C2C12 cells. Blank arrows point to the incomplete mitochondrial membrane, and red asterisks indicate indistinct cristae. The zoomed-in area (scale bars: 1 µm) is an enlarged image of the boxed area in the left image (scale bars: 2 µm). (B, C) (B) DRP1 and (C) OPA1 IF staining of C2C12 cells and fluorescence quantitative statistics shown below (n = 4 areas). Scale bars: 50 µm. P value for blank vs control, control vs FOXK2-KO, FOXK2-KO vs KO + EV, KO + EV vs KO + WT, KO + WT vs KO + R215W and KO + EV vs KO + R215W: DRP1: ns-P = 0.2406; ****P < 0.0001; ns-P = 0.9454; ***P = 0.0003; **P = 0.0015; *P = 0.0429. OPA1: ns-P = 0.8264; *P = 0.0456; ns-P = 0.2234; ****P < 0.0001; *P = 0.0433; **P = 0.0092. (D) Representative images of C2C12 cells by JC-1 staining. Scale bars: 100 µm. (E) Quantitative statistics of mean red/green ratio fluorescence intensity of (D) to measure mitochondrial membrane potential (n = 3 areas). P value: **P = 0.0097; *P = 0.0390; blank vs control, ns-P = 0.9385; FOXK2-KO vs KO + EV, ns-P = 0.5861; KO + EV vs KO + R215W, ns-P = 0.1023; KO + WT and KO + R215W, ns-P = 0.3174. (F) Quantification of ATP contents in C2C12 cells (n = 3 repeats). The values were normalized to the total cellular protein level. P value: ****P < 0.0001; **P = 0.0013; blank vs control, ns-P = 0.0961; control vs FOXK2-KO, ***P = 0.0004; FOXK2-KO vs KO + EV, ns-P = 0.1541; KO + EV vs KO + R215W, ***P = 0.0003. (G) Quantitative analysis of fluorescence intensity to measure ROS levels in C2C12 cells by DCFH-DA staining (n = 4 repeats). P value: ****P < 0.0001; ***P = 0.0007; **P = 0.0050; *P = 0.0337; blank vs control, ns-P = 0.7027; FOXK2-KO vs KO + EV, ns-P = 0.2653. (H) Quantitative of mtDNA copy number in C2C12 cells measured by qPCR (n = 3 repeats). P value: blank vs control, ns-P = 0.5916; control vs FOXK2-KO, *P = 0.0214; FOXK2-KO vs KO + EV, ns-P = 0.4779; KO + EV vs KO + WT, *P = 0.0234; KO + WT vs KO + R215W, ns-P = 0.2577; KO + EV vs KO + R215W, ns-P = 0.3716. (I) Quantitative of relative mitochondrial relative gene expression levels in C2C12 cells by qPCR (n = 3 repeats). P value for blank vs control, control vs FOXK2-KO, FOXK2-KO vs KO + EV, KO + EV vs KO + WT, KO + WT vs KO + R215W and KO + EV vs KO + R215W: Pgc1a: ns-P = 0.6530; ***P = 0.0005; ns-P = 0.5826; ***P = 0.0002; ns-P = 0.1210; **P = 0.0011. Tfb1m: ns-P = 0.1746; **P = 0.0032; ns-P = 0.1248; *P = 0.0302; ns-P = 0.0663; ns-P = 0.1662. Tfb2m: ns-P = 0.1434; **P = 0.0064; ns-P = 0.4715; **P = 0.0047; ns-P = 0.0556; ns-P = 0.4704. Data were analyzed by Student’s t test. All error bars indicate mean ± standard deviation. Blank untreated wild-type C2C12 cells, control C2C12 cells transfected with a blank vector as a control for the FOXK2-KO group, FOXK2-KO FOXK2 knockout C2C12 cells, KO + EV FOXK2-KO cells transfected with a blank vector as a control for KO + WT and KO + R215W groups, KO + WT FOXK2-KO cells with overexpression of the human wild-type FOXK2 vector, KO + R215W FOXK2-KO cells with overexpression of the human FOXK2 R215W mutation vector, ROS reactive oxygen species, TEM transmission electron microscopy, IF immunofluorescence, DCFH-DA Dichlorodihydrofluorescein diacetate, mtDNA mitochondrial DNA, qPCR quantitative real-time polymerase chain reaction. Source data are available online for this figure.
|