
- Title
-
Parp1 deletion rescues cerebellar hypotrophy in xrcc1 mutant zebrafish
- Authors
- Semenova, S.A., Nammi, D., Garrett, G.B., Margolin, G., Sinclair, J.L., Maroofian, R., Caldecott, K.W., Burgess, H.A.
- Source
- Full text @ Sci. Rep.
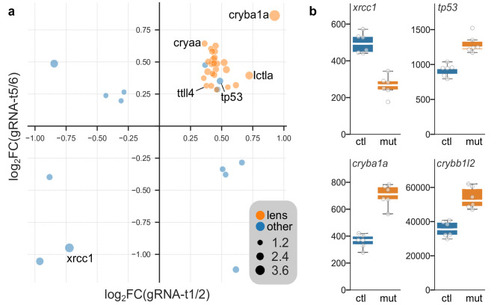
Differentially expressed genes in |
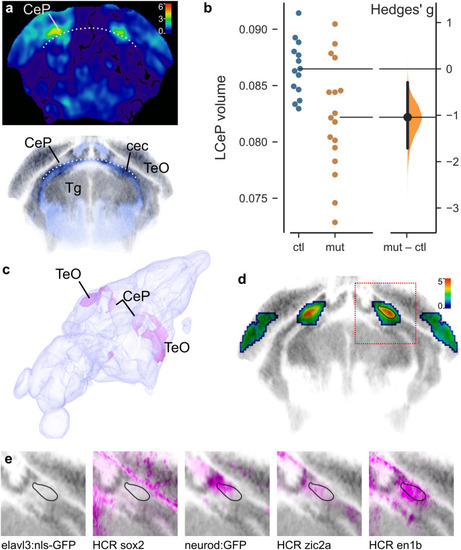
Reduced cerebellar plate volume in PHENOTYPE:
|
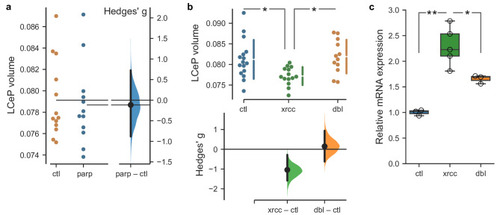
Rescue of |