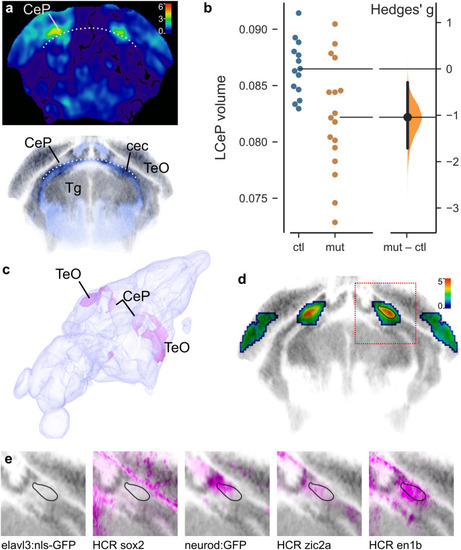
Reduced cerebellar plate volume in xrcc1 crispants. (a) Coronal section through the cerebellum of the voxelwise p-value map for voxel volume in controls versus mutants. Color bar indicates − 1×log10(p-value). Lower panel: Same section from ZBB atlas showing cells (grey) and neuropil (blue). Dotted line marks the upper boundary of the cerebellar commissure (cec) that separates the cerebellar plate (CeP) from the prepontine tegmentum (Tg). At this level, CeP is positioned ventrally to the midbrain optic tectum (TeO). (b) Volume (as percentage of total brain volume) of the affected part of the lateral cerebellar plate (LCeP) in second experiment using gRNAs-t5/6. N = 14 controls, 17 crispants. (c) 3D projection from the Zebrafish Brain Browser superimposing on a brain model, the location of voxels that during brain registration, had to be inflated more in crispants than in controls (indicating areas that were smaller in the crispants). (d) Coronal section (same plane as in (a)), through map of p-values for changes in voxel volume in xrcc1 crispants derived from combining gRNA-t1/2 and gRNA-t5/6 experiments using ANOVA at each voxel. Color scale indicates -log10(p-value). p-values greater than 0.01 removed. Red square shows region shown in (e). Black outline in right cerebellum corresponds to outlines in (e). (e) Characterization of the affected area by comparison to expression in transgenic lines elavl3:nls-GFP (marking neuronal somas) and neurod: GFP, and hybridization chain reaction (HCR) fluorescent in situ images for sox2, zic2a and en1b.
|
