
IMAGE
Fig. 1
- ID
- ZDB-IMAGE-250519-7
- Genes
- Publication
- Semenova et al., 2025 - Parp1 deletion rescues cerebellar hypotrophy in xrcc1 mutant zebrafish
- All Figures
- Figures for Semenova et al., 2025
Image
|
Figure Caption
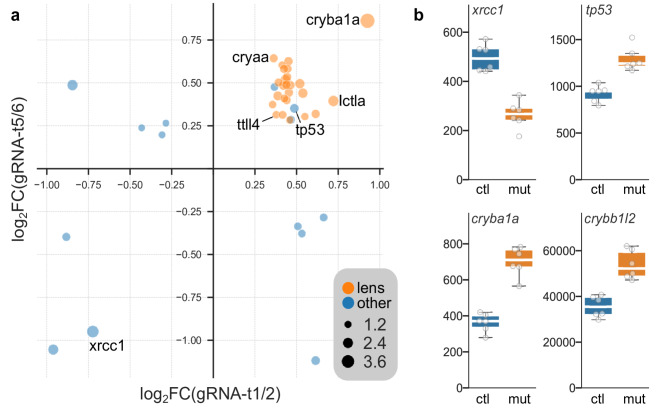
Fig. 1
Differentially expressed genes in
Figure Data
Acknowledgments
This image is the copyrighted work of the attributed author or publisher, and
ZFIN has permission only to display this image to its users.
Additional permissions should be obtained from the applicable author or publisher of the image.
Full text @ Sci. Rep.