FIGURE SUMMARY
Title

KDM6A Deficiency Induces Myeloid Bias and Promotes CMML-Like Disease Through JAK/STAT3 Activation by Repressing SOCS3

Authors
Chen, H., Wang, S., Dong, R., Yu, P., Li, T., Hu, L., Wang, M., Qian, Z., Zhou, H., Yue, X., Wang, L., Xiao, H.
Source
Full text @ Adv Sci (Weinh)

kdm6a is required for HSPC emergence in zebrafish. A,B) WISH for runx1 A) and %phenotype distribution B) in embryos at 28 hpf as indicated (n = 4, mean ± SD, Student's t test). C,D) WISH for runx1 C) and %phenotype distribution D) in embryos at 30 hpf as indicated (n = 4, mean ± SD, Student's t test). E,F) WISH for cmyb E) and %phenotype distribution F) in embryos at 30 hpf as indicated (n = 4, mean ± SD, Student's t test). G,H) WISH for cmyb G) and %phenotype distribution H) in embryos at 3 dpf as indicated (n = 4, mean ± SD, Student's t test). I,J) WISH for rag1 I) and %phenotype distribution J) in embryos at 4 dpf as indicated (n = 4, mean ± SD, Student's t test). K) Flow cytometry plots of kdrl:mCherry+; runx1:eGFP+ double positive cells at 28 hpf (left). Graphs depicting the percentage of kdrl:mCherry+; runx1:eGFP+ hemogenic endothelial cells per embryo at 28 hpf (right) (n = 4, mean ± SD, Student's t test). L) Confocal imaging of kdrl:mCherry+; cmyb:eGFP+ hemogenic endothelial cells in AGM at 48 hpf (left, white arrowheads). Graphs depicting the number of kdrl:mCherry+; cmyb:eGFP+ cells per embryo at 48 hpf (right) (n = 5, mean ± SD, Student's t test). M) Flow cytometry plots of cd41:eGFPlow cells at 3 dpf (left). Graphs depicting the percentage of cd41:eGFPlow HSPCs per embryo at 3 dpf (right) (n = 5, mean ± SD, Student's t test). N,O) WISH for runx1 N) and %phenotype distribution O) in embryos at 28 hpf as indicated (n = 4, mean ± SD, one‐way ANOVA). **p <0.01; ***p < 0.001.

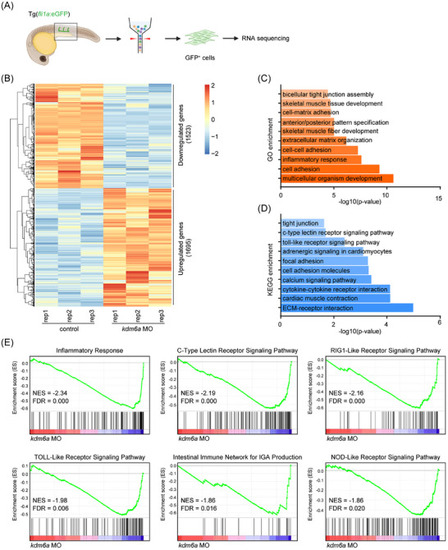
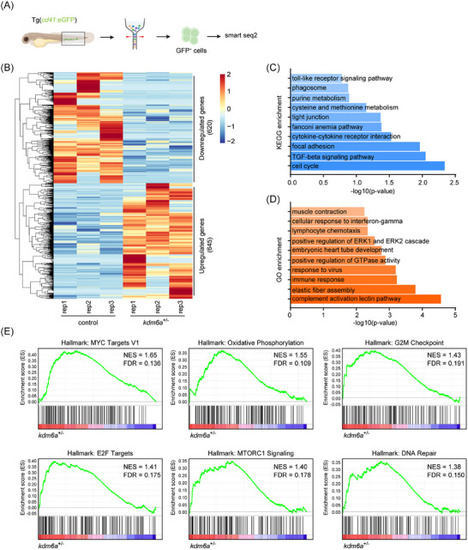
Loss of Kdm6a deregulates inflammatory gene expression in ECs. A) Flowchart of sorting and RNA sequencing. B) Heatmap of differentially expressed genes in endothelial cells from kdm6a morphants and their WT controls at 28 hpf via RNA‐seq (cut‐off fold change 1.5, p < 0.05). C) Gene ontology (GO) enrichment analysis of biological processes based on differentially expressed genes identified through RNA‐seq. D) Kyoto Encyclopedia of Genes and Genomes (KEGG) analysis based on differentially expressed genes identified through RNA‐seq. E) Gene set enrichment analysis (GESA) of RNA expression profiles in endothelial cells from kdm6a morphants and their WT controls at 28 hpf.

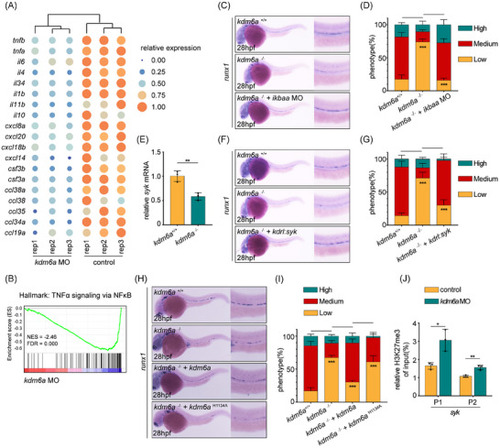
Kdm6a regulates HSPC production via Syk‐associated inflammatory response in a H3K27me3‐dependent manner. A) Heatmap showing differential expression of inflammatory‐associated genes. B) Enrichment plot of the TNFα signaling via NF‐κB between differentially regulated genes in kdm6a morphants and their WT controls by GSEA. C,D) WISH for runx1 C) and %phenotype distribution D) in WT control, kdm6a mutants, and kdm6a mutants with ikbaa morphants at 28 hpf as indicated (n = 4, mean ± SD, one‐way ANOVA). E) qPCR analysis of syk expression in sorted endothelial cells from WT control and kdm6a mutants at 28 hpf (n = 3, mean ± SD, Student's t test). F,G) WISH for runx1 F) and %phenotype distribution G) in WT control, kdm6a mutants, and kdm6a mutants with kdrl:syk constructs at 28 hpf (n = 4, mean ± SD, one‐way ANOVA). H,I) WISH for runx1 H) and %phenotype distribution I) in WT control, kdm6a mutants, kdm6a mutants with kdm6a mRNA, and kdm6a mutants with kdm6aH1134A mRNA at 28 hpf (n = 4, mean ± SD, one‐way ANOVA). J) ChIP‐qPCR analyses of syk promoter in kdm6a morphants and their WT controls by using an anti‐H3K27me3 antibody at 28 hpf (n = 3, mean ± SD, Student's t test). *p <0.05; **p <0.01; ***p < 0.001.

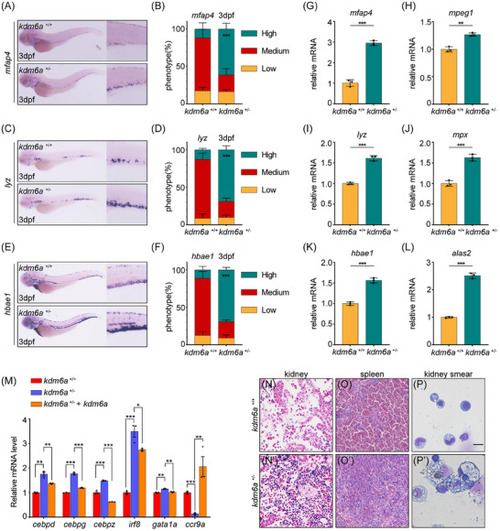
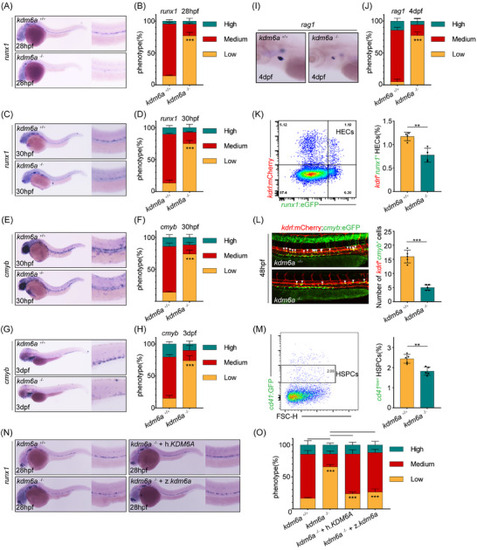
Haploinsufficiency of Kdm6a has skewed myelopoiesis in embryonic and adult zebrafish. A,B) WISH for mfap4 A) and %phenotype distribution B) in embryos at 3 dpf as indicated (n = 4, mean ± SD, Student's t test). C,D) WISH for lyz C) and %phenotype distribution D) in embryos at 3 dpf as indicated (n  = 4, mean ± SD, Student's t test). E,F) WISH for hbae1 E) and %phenotype distribution F) in embryos at 3 dpf as indicated (n = 4, mean ± SD, Student's t test). G–L) qPCR analysis of mfap4, mpeg1, lyz, mpx, hbae1, and alas2 expression in WT control and kdm6a+/− mutant embryos at 3 dpf (n = 3, mean ± SD, Student's t test). M) qPCR analysis of lineage differentiation‐related transcription factors expression including cebpd, cebpg, cebpz, irf8, gata1a, and ccr9a in cd41:eGFPlow HSPCs isolated from WT control or kdm6a+/− mutant embryos (n = 3, mean ± SD, one‐way ANOVA). N‐N’) Hematoxylin and eosin staining of paraffin‐embedded sections of kidney from representative WT control or kdm6a+/− mutant adults. O‐O’) Hematoxylin and eosin staining of paraffin‐embedded sections of spleen from representative WT control or kdm6a+/− mutant adults. P‐P’) May–Grünwald–Giemsa staining of whole kidney marrow (KM) cells presentative 3 kdm6a+/− fish with CMML‐like phenotypes (totally 12 kdm6a+/− adults were used for experiment). *p <0.05; **p <0.01; ***p < 0.001.

Haploinsufficiency of Kdm6a dysregulates aging related gene expression in HSPCs. A) Flowchart of sorting and RNA sequencing. B) Heatmap of differentially expressed genes in HSPCs from kdm6a+/− mutants and their WT controls at 3 dpf via RNA‐seq (cut‐off fold change 1.5, p < 0.05). C) Gene ontology (GO) enrichment analysis of biological processes based on differentially expressed genes identified through RNA‐seq. D) Kyoto Encyclopedia of Genes and Genomes (KEGG) analysis based on differentially expressed genes identified through RNA‐seq. E) Gene set enrichment analysis (GESA) of RNA expression profiles in HSPCs from kdm6a+/− mutants and their WT controls at 3 dpf.

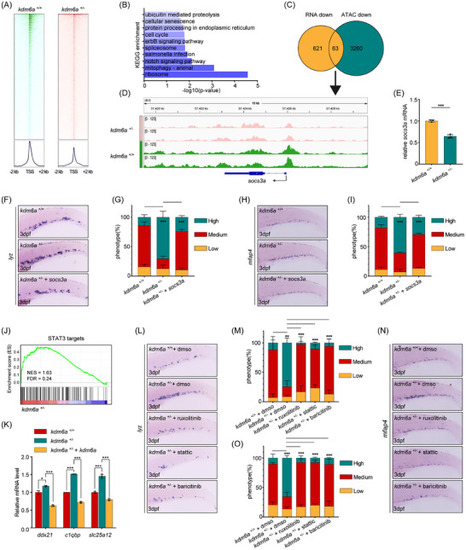
Haploinsufficiency of Kdm6a promotes myeloid‐biased hematopoiesis through repressing socs3a and activating Jak/Stat3 signaling. A) Heatmaps showing the binding signals of ATAC at the promoter regions (TSS±2kb) in cd41:eGFPlow HSPCs at 3 dpf from WT control and kdm6a+/− mutants. B) Kyoto Encyclopedia of Genes and Genomes (KEGG) analysis based on genes with differentially accessible chromatin at promoter regions. C) Venn plot showing the overlap of genes with specific accessible chromatin at promoter regions and downregulated expression in kdm6a+/− HSPCs. Genes for ATAC‐seq were assigned by differentially accessible chromatin at promoter regions. D) Genome browser tracks for ATAC enrichment signals across the socs3a locus in WT control and kdm6a+/− mutants. E) qPCR analysis of socs3a expression in sorted HSPCs from WT control and kdm6a+/− mutants at 3 dpf (n = 3, mean ± SD, Student's t test). F,G) WISH for runx1 F) and %phenotype distribution G) in WT control, kdm6a+/− mutants, and kdm6a+/− mutants with socs3a mRNA at 3 dpf (n = 4, mean ± SD, one‐way ANOVA). (H‐I) WISH for mfap4 H) and %phenotype distribution I) in WT control, kdm6a+/− mutants, and kdm6a+/− mutants with socs3a mRNA at 3 dpf (n = 4, mean ± SD, one‐way ANOVA). J) Enrichment plot of the STAT3 targets between differentially regulated genes in kdm6a+/− HSPCs and their WT controls by GSEA. K) qPCR analysis of STAT3 targets including ddx21, c1qbp, and slc25a12 in cd41:eGFPlow HSPCs isolated from WT control and kdm6a+/− mutant embryos (n  = 3, mean ± SD, one‐way ANOVA). (L‐M) WISH for lyz L) and %phenotype distribution M) in WT control, kdm6a+/− mutants, kdm6a+/− mutants with ruxolitinib, kdm6a+/− mutants with static, and kdm6a+/− mutants with baricitinib at 3 dpf (n = 3, mean ± SD, one‐way ANOVA). N,O) WISH for mfap4 N) and %phenotype distribution O) in WT control, kdm6a+/− mutants, kdm6a+/− mutants with ruxolitinib, kdm6a+/− mutants with static, and kdm6a+/− mutants with baricitinib at 3 dpf (n = 3, mean ± SD, one‐way ANOVA). *p <0.05; **p <0.01; ***p < 0.001.

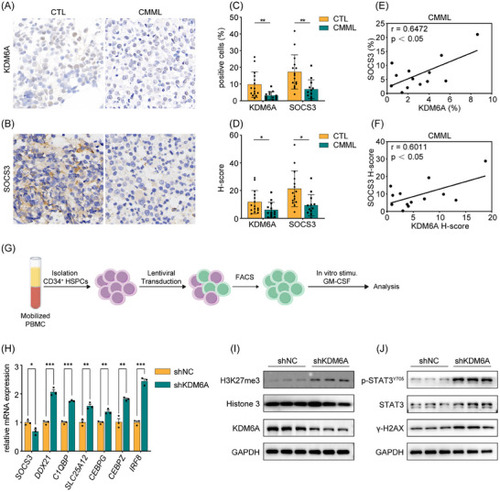
KDM6A/SOCS3/p‐STAT3 pathway is conserved in human HSPCs. A) Immunohistochemical staining of KDM6A on BM biopsies. B) Immunohistochemical staining of SOCS3 on BM biopsies. C) The percentage of KDM6A+ and SOCS3+cells in immunohistochemical staining. D) The H‐score of KDM6A+ and SOCS3+ cells immunohistochemical staining. E) Correlation analysis of the percentage of KDM6A+ (C, left) and SOCS3+ (C, right) cells in CMML specimens. F) Correlation analysis of the H‐score of KDM6A+ (D, left) and SOCS3+ (D, right) cells in CMML specimens. G) Schematic representation of human HSPC enrichment, lentiviral infection, and in vitro stimulation experiments conducted in this study. H) qPCR analysis of genes expression including SOCS3, DDX21, C1QBP, SLC25A12, CEBPG, CEBPZ, and IRF8 in human HSPCs after GM‐CSF stimulation (n = 3, mean ± SD, Student's t test). I) Western Blot analysis of KDM6A, and H3K27me3 in human HSPCs after GM‐CSF stimulation. (J) Western Blot analysis of γH2AX, STAT3, and p‐STAT3Y705 in human HSPCs after GM‐CSF stimulation. *p <0.05; **p <0.01; ***p < 0.001.

Acknowledgments
This image is the copyrighted work of the attributed author or publisher, and ZFIN has permission only to display this image to its users. Additional permissions should be obtained from the applicable author or publisher of the image. Full text @ Adv Sci (Weinh)