IMAGE

Figure 2

ID
ZDB-IMAGE-250607-29
Source
Figures for Chen et al., 2025
Image
Figure Caption

Figure 2

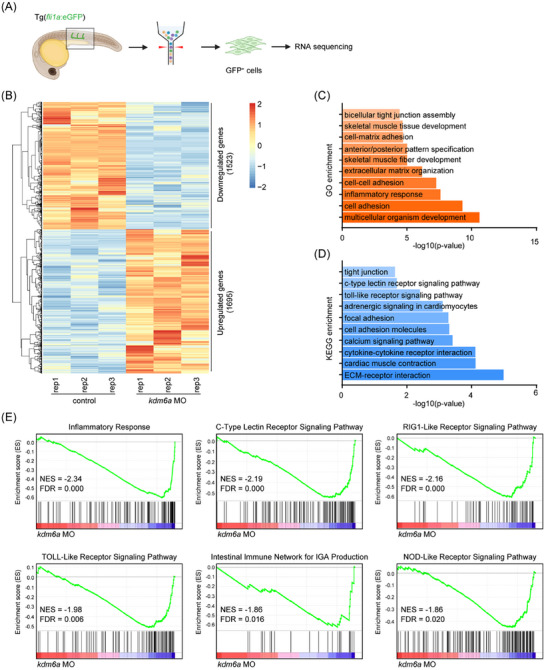
Loss of Kdm6a deregulates inflammatory gene expression in ECs. A) Flowchart of sorting and RNA sequencing. B) Heatmap of differentially expressed genes in endothelial cells from kdm6a morphants and their WT controls at 28 hpf via RNA‐seq (cut‐off fold change 1.5, p < 0.05). C) Gene ontology (GO) enrichment analysis of biological processes based on differentially expressed genes identified through RNA‐seq. D) Kyoto Encyclopedia of Genes and Genomes (KEGG) analysis based on differentially expressed genes identified through RNA‐seq. E) Gene set enrichment analysis (GESA) of RNA expression profiles in endothelial cells from kdm6a morphants and their WT controls at 28 hpf.

Acknowledgments
This image is the copyrighted work of the attributed author or publisher, and ZFIN has permission only to display this image to its users. Additional permissions should be obtained from the applicable author or publisher of the image. Full text @ Adv Sci (Weinh)