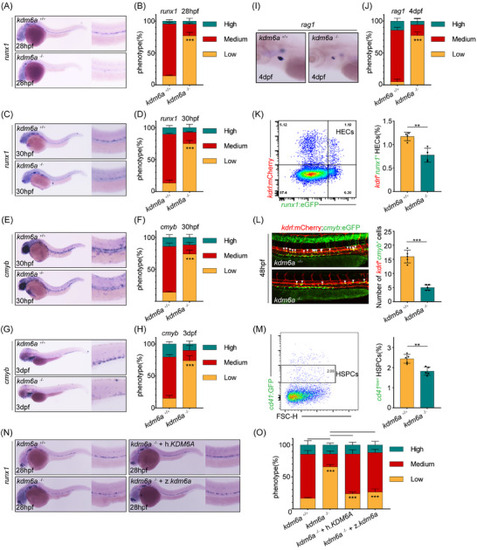
kdm6a is required for HSPC emergence in zebrafish. A,B) WISH for runx1 A) and %phenotype distribution B) in embryos at 28 hpf as indicated (n = 4, mean ± SD, Student's t test). C,D) WISH for runx1 C) and %phenotype distribution D) in embryos at 30 hpf as indicated (n = 4, mean ± SD, Student's t test). E,F) WISH for cmyb E) and %phenotype distribution F) in embryos at 30 hpf as indicated (n = 4, mean ± SD, Student's t test). G,H) WISH for cmyb G) and %phenotype distribution H) in embryos at 3 dpf as indicated (n = 4, mean ± SD, Student's t test). I,J) WISH for rag1 I) and %phenotype distribution J) in embryos at 4 dpf as indicated (n = 4, mean ± SD, Student's t test). K) Flow cytometry plots of kdrl:mCherry+; runx1:eGFP+ double positive cells at 28 hpf (left). Graphs depicting the percentage of kdrl:mCherry+; runx1:eGFP+ hemogenic endothelial cells per embryo at 28 hpf (right) (n = 4, mean ± SD, Student's t test). L) Confocal imaging of kdrl:mCherry+; cmyb:eGFP+ hemogenic endothelial cells in AGM at 48 hpf (left, white arrowheads). Graphs depicting the number of kdrl:mCherry+; cmyb:eGFP+ cells per embryo at 48 hpf (right) (n = 5, mean ± SD, Student's t test). M) Flow cytometry plots of cd41:eGFPlow cells at 3 dpf (left). Graphs depicting the percentage of cd41:eGFPlow HSPCs per embryo at 3 dpf (right) (n = 5, mean ± SD, Student's t test). N,O) WISH for runx1 N) and %phenotype distribution O) in embryos at 28 hpf as indicated (n = 4, mean ± SD, one‐way ANOVA). **p <0.01; ***p < 0.001.
|
