IMAGE

Figure 1

ID
ZDB-IMAGE-250607-28
Source
Figures for Chen et al., 2025
Image
Figure Caption

Figure 1

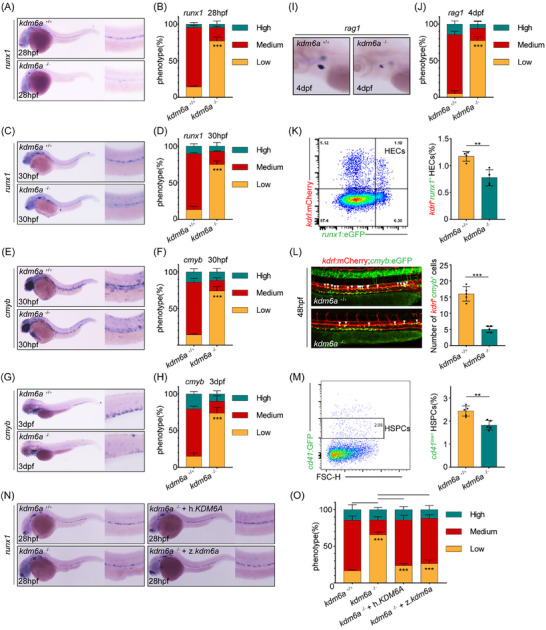
kdm6a is required for HSPC emergence in zebrafish. A,B) WISH for runx1 A) and %phenotype distribution B) in embryos at 28 hpf as indicated (n = 4, mean ± SD, Student's t test). C,D) WISH for runx1 C) and %phenotype distribution D) in embryos at 30 hpf as indicated (n = 4, mean ± SD, Student's t test). E,F) WISH for cmyb E) and %phenotype distribution F) in embryos at 30 hpf as indicated (n = 4, mean ± SD, Student's t test). G,H) WISH for cmyb G) and %phenotype distribution H) in embryos at 3 dpf as indicated (n = 4, mean ± SD, Student's t test). I,J) WISH for rag1 I) and %phenotype distribution J) in embryos at 4 dpf as indicated (n = 4, mean ± SD, Student's t test). K) Flow cytometry plots of kdrl:mCherry+; runx1:eGFP+ double positive cells at 28 hpf (left). Graphs depicting the percentage of kdrl:mCherry+; runx1:eGFP+ hemogenic endothelial cells per embryo at 28 hpf (right) (n = 4, mean ± SD, Student's t test). L) Confocal imaging of kdrl:mCherry+; cmyb:eGFP+ hemogenic endothelial cells in AGM at 48 hpf (left, white arrowheads). Graphs depicting the number of kdrl:mCherry+; cmyb:eGFP+ cells per embryo at 48 hpf (right) (n = 5, mean ± SD, Student's t test). M) Flow cytometry plots of cd41:eGFPlow cells at 3 dpf (left). Graphs depicting the percentage of cd41:eGFPlow HSPCs per embryo at 3 dpf (right) (n = 5, mean ± SD, Student's t test). N,O) WISH for runx1 N) and %phenotype distribution O) in embryos at 28 hpf as indicated (n = 4, mean ± SD, one‐way ANOVA). **p <0.01; ***p < 0.001.

Acknowledgments
This image is the copyrighted work of the attributed author or publisher, and ZFIN has permission only to display this image to its users. Additional permissions should be obtained from the applicable author or publisher of the image. Full text @ Adv Sci (Weinh)