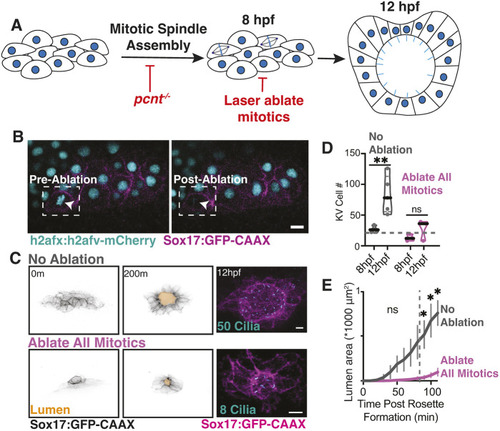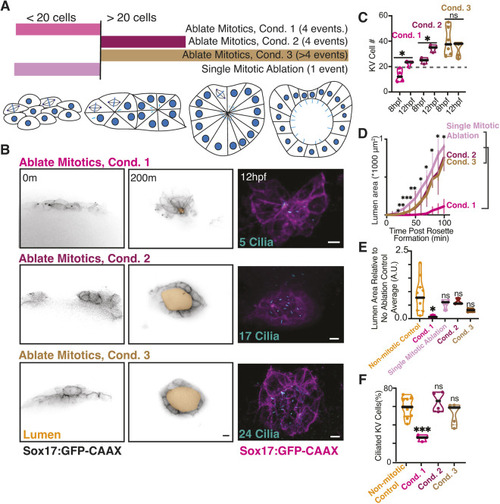
Early KV developmental mitotic events hold greater significance to KV development compared to later KV mitotic events. (A) Model illustrating laser ablation conditions during KV development. Pale blue lines represent cilia. (B) Confocal projections taken from a movie acquisition (0-200 min, left; Sox17:GFP-CAAX, inverted gray; lumen, gold; see also Movie 5). The embryos were then fixed at 6SS (12 hpf) and stained for cilia (acetylated tubulin, cyan, right; Sox17:GFP-CAAX in magenta). The number of cilia in each representative image is noted. m, min. Scale bars: 10 μm. (C) Truncated violin plot depicting the number of KV cells at 8 hpf and 12 hpf for ablation conditions 1, 2 or 3 across n≥3 embryos (each point represents a single embryo). Median denoted with black line and 20 KV cell threshold demonstrated with gray dashed line. *P<0.05 (unpaired, two-tailed Student's t-test); ns, not significant. (D) Lumen area was measured over time for over 100 min for ablation conditions 1, 2, 3, or a single mitotic cell ablation. n≥3 embryos measured per condition. Error bars represent s.e.m. *P<0.05, **P<0.01, ***P<0.001 (one-way ANOVA with Dunnett's multiple comparison); ns, not significant. (E,F) Truncated violin plots depicting KV lumen area (12 hpf; E) and percentage of ciliated KV cells (F). n≥3 embryos for each condition. *P<0.05, ***P<0.001 (one-way ANOVA with Dunnett's multiple comparison to non-mitotic ablation controls); ns, not significant. A.U., arbitrary units; Cond., condition.
|