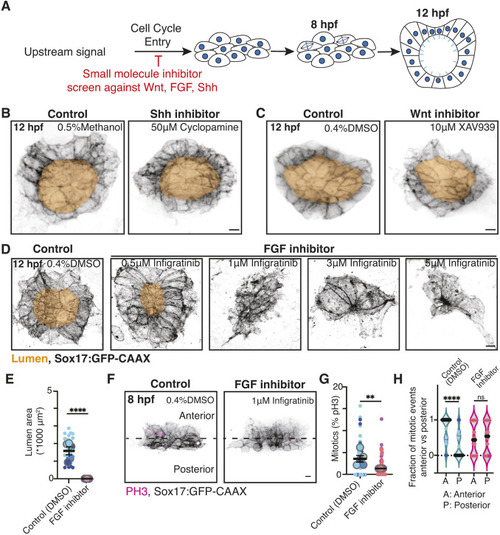
FGF contributes to mitotic events being enriched at the anterior half of the KV. (A) Model illustrating the experimental approach to identify whether a signal influences mitotic events during KV development. Pale blue lines represent cilia. (B-D) Confocal projections of post lumen (12 hpf) embryos treated with methanol (control), 50 μM cyclopamine (B), DMSO (control), 10 μM XAV939 (C), or 0.5 μM, 1 μM, 3 μM or 5 μM infigratinib (D). KV cell membranes are marked with Sox17:GFP-CAAX (inverted gray), lumens are highlighted in gold. Scale bars: 10 μm. (E) Lumen area was measured for n≥29 embryos per control and 1 μM infigratinib (FGF inhibition) conditions. Super plot is shown with small dots representing each embryo and color coded to match clutch. n≥3 clutches were measured with large dots representing clutch. Mean of clutches is shown ±s.e.m. ****P<0.0001 (unpaired, two-tailed Student's t-test). (F) Confocal projections of 8 hpf KVs treated with DMSO (control) or 1 μM infigratinib (FGF inhibition). Mitotic events were marked with PH3 (magenta). KV cell membranes were marked with Sox17:GFP-CAAX (inverted gray). Scale bar: 10 μm. (G) Percentage mitotics within developing KVs at 8 hpf was measured for n≥53 embryos per control and 1μM infigratinib (FGF inhibition) conditions. Super plot shown with small dots representing each embryo and are color coded to match clutch. n≥3 clutches were measured with large dots representing clutch. Mean of clutches shown ±s.e.m. **P<0.01 (unpaired, two-tailed Student's t-test). (H) Fraction of PH3-positive cells in the anterior versus posterior regions of the KV at 8 hpf. n≥33 embryos were used per control and 1 μM infigratinib (FGF inhibition) conditions. Each point represents an embryo, the point colors represent clutch, n≥3 clutches. ****P<0.0001 (unpaired, two-tailed Student's t-test); ns, not significant.
|
