IMAGE

Fig. 3.

ID
ZDB-IMAGE-250611-77
Source
Figures for Wu et al., 2025
Image
Figure Caption

Fig. 3.

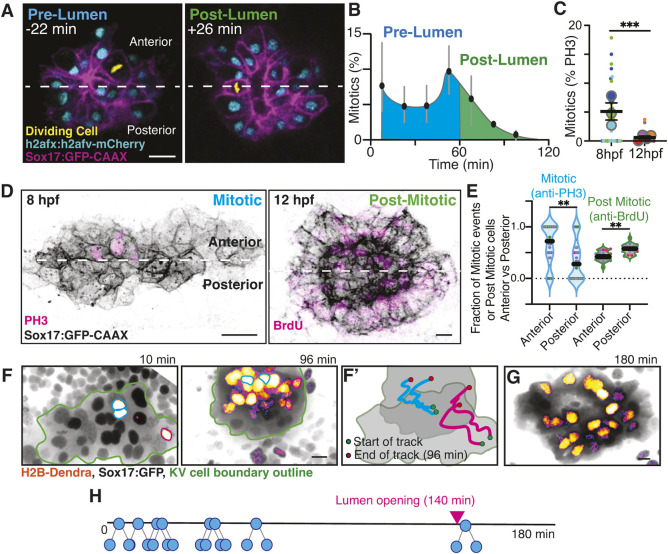
Identification of an increased number of anteriorly enriched mitotic cells in the KV prior to lumen formation compared to evenly distributed post-mitotic cells post lumen formation. (A) Representative confocal projections from KV development movie (Movie 2). Pre-KV lumen time point (−22 min before lumen opening) and post-lumen (26 min after lumen opening) are shown. KV cell membranes are marked by Sox17:GFP-CAAX (magenta) and nuclei with h2afx:h2afv-mCherry (non-mitotic, cyan; mitotic, yellow). Scale bar: 10 μm. (B) Percentage of KV cells that are mitotic in 20 min bins (data points) throughout a 120 min movie time course (n=3 embryos; error bars represent s.e.m.). (C) Percentage of mitotic KV cells was measured for n≥23 embryos (small dots represent embryos color coded to match clutch) across n≥3 clutches (large dots represent clutch) at 8 hpf and 12 hpf. Graphs are super plots with mean of clutches ±s.e.m. ***P<0.001 (unpaired, two-tailed Student's t-test). (D) Confocal projections of mitotic (PH3, magenta) and post-mitotic (BrdU, magenta) events at pre lumen (8 hpf) and post lumen (12 hpf) stages. KV cell membranes are marked with Sox17:GFP-CAAX (inverted gray). Dashed line indicates division of the KV into anterior and posterior regions. Scale bars: 10 μm. (E) Fraction of PH3- and BrdU-positive cells in the anterior versus posterior regions of the KV (n=4 clutches, 36 embryos; and n=3 clutches, n=17 embryos, respectively, for PH3 and BrdU). Each point represents an embryo, and the point colors represent clutch. **P<0.01 (unpaired, two-tailed Student's t-test). (F,G) Confocal projections of H2B-Dendra photoconversion (non-photoconverted black nuclei; photo-converted in fire-LUT). Cyan and magenta outlines mark mitotic photoconverted event at 10 min. A total of eight mitotic events were photoconverted. Daughter cell positioning at 96 min and 180 min is shown (G). (F′) Trajectory of marked mitotic events from division completion to 96 min. KV cell boundary, green outline. Scale bars: 10 μm. (H) Temporal schematic of KV mitotic event for the representative embryo shown in F; the daughter cells did not divide again.

Acknowledgments
This image is the copyrighted work of the attributed author or publisher, and ZFIN has permission only to display this image to its users. Additional permissions should be obtained from the applicable author or publisher of the image. Full text @ Development