IMAGE

Fig. 2.

ID
ZDB-IMAGE-250611-76
Source
Figures for Wu et al., 2025
Image
Figure Caption

Fig. 2.

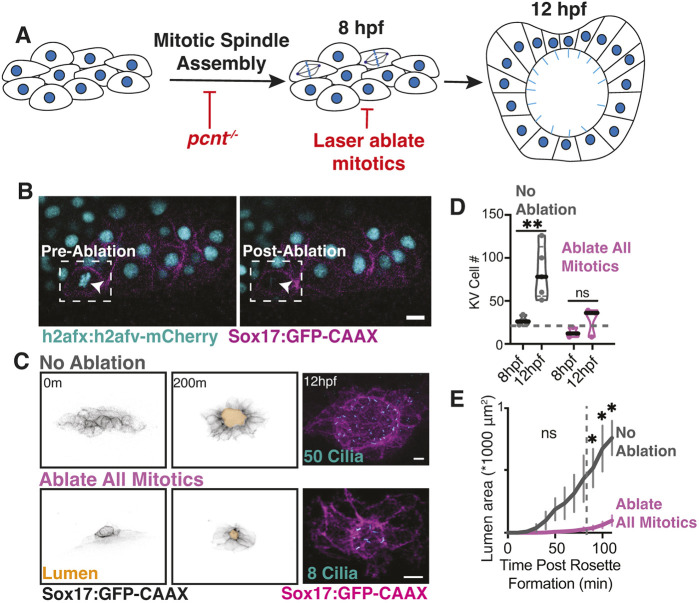
KV-specific mitotic events contribute to KV development. (A) Model illustrating experimental approaches to identify the role of mitotic events on KV development. Pale blue lines represent cilia. (B) Representative images of the KV ablation experiment showing a pre-ablation and post-ablation cell. White arrowheads highlight the KV cell ablated. KV cell membranes marked by Sox17:GFP-CAAX (magenta) and nuclei with h2afx:h2afv-mCherry (cyan). Scale bar: 10 μm. (C) Confocal projections taken from a movie acquisition (0-200 min, Sox17:GFP-CAAX, inverted gray; see also Movie 1). Lumens were traced and highlighted in gold. The embryo was fixed at 12 hpf and stained for cilia (acetylated tubulin, cyan; Sox17:GFP-CAAX, magenta). The number of cilia in each representative image is noted. m, min. Scale bars: 10 μm. (D) Truncated violin plot depicting the number of KV cells at 8 hpf and 12 hpf for ‘no ablation’ and ‘all mitotics ablated’ conditions across n≥3 embryos (each point represents a single embryo). Median denoted with black line and 20 KV cell threshold demonstrated with gray dashed line. **P<0.01 (unpaired, two-tailed Student's t-test); ns, not significant. (E) Lumen area was measured over time for over 100 min for ‘no ablation’ (control) and ‘all mitotics ablated’ conditions. n≥3 embryos measured per condition. Error bars represent s.e.m. *P<0.05 (unpaired, two-tailed Student's t-test); ns, not significant.

Acknowledgments
This image is the copyrighted work of the attributed author or publisher, and ZFIN has permission only to display this image to its users. Additional permissions should be obtained from the applicable author or publisher of the image. Full text @ Development