
- Title
-
Modulation of NMDA receptor signaling and zinc chelation prevent seizure-like events in a zebrafish model of SLC13A5 epilepsy
- Authors
- Dogra, D., Phan, V.A., Zhang, S., Gavrilovici, C., DiMarzo, N., Narang, A., Ibhazehiebo, K., Kurrasch, D.M.
- Source
- Full text @ PLoS Biol.
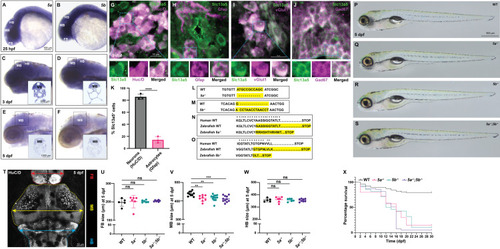
Expression analysis of PHENOTYPE:
|
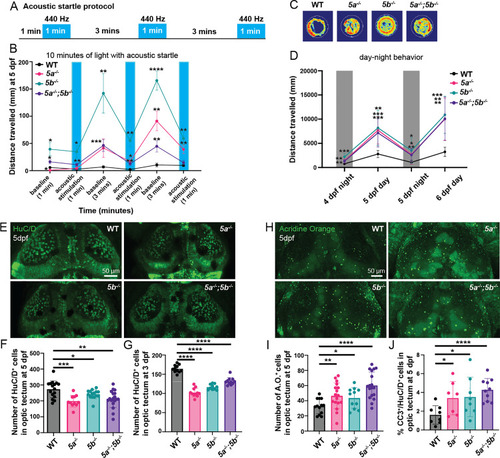
Analysis of startle response and circadian disturbances in (A) Schematic representation of acoustic startle protocol. (B) Quantification of distance traveled during baseline and acoustic stimulation periods at 5 dpf. PHENOTYPE:
|
E/I imbalance, |
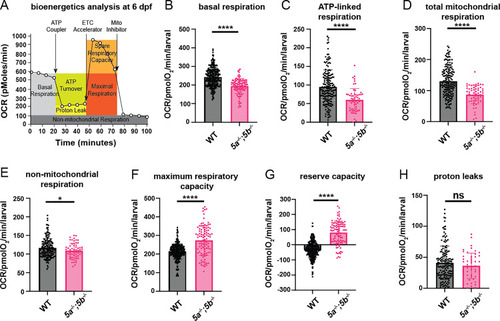
Metabolic health analysis in (A) Schematic representation of how the Seahorse bioanalyzer displays mitochondrial bioenergetics being regulated by pharmacological inhibitors. (B) Quantification of basal respiration at 6 dpf. PHENOTYPE:
|
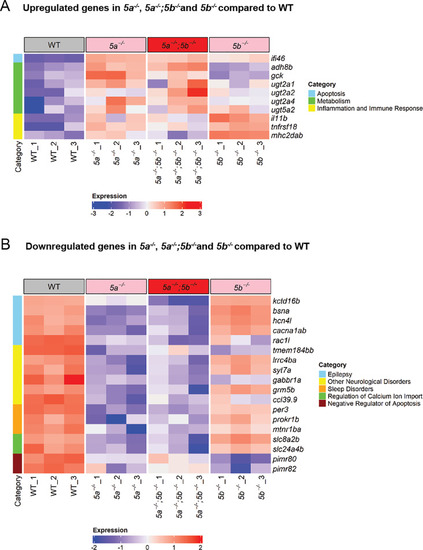
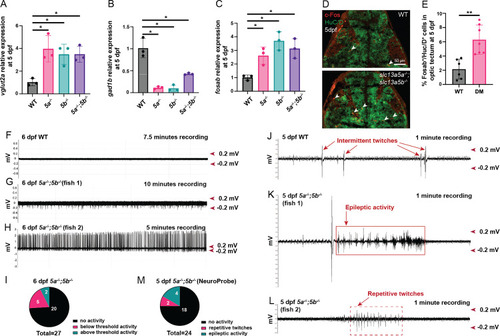
Transcriptomics profiling of |

Assessment of calcium events, pERK levels, NMDA receptor expression and extracellular zinc levels in EXPRESSION / LABELING:
|

Effect of NMDA receptor signaling suppression and zinc treatment on PHENOTYPE:
|
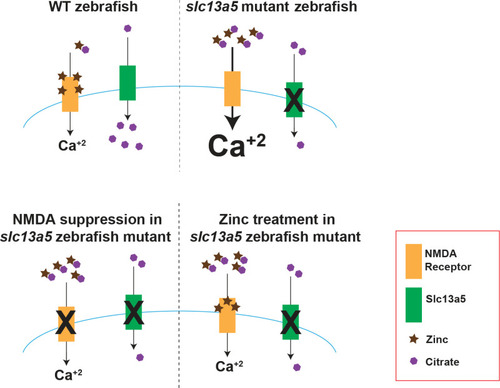
Model of relationship between Unlike in WT larvae, |