|
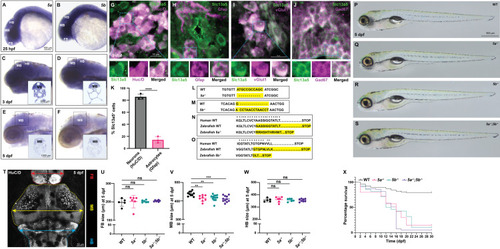
Expression analysis of slc13a5 zebrafish paralogs (5a and 5b) and generation of zebrafish slc13a5 mutants using CRISPR/Cas9 technique. (A-F) In situ hybridization for 5a and 5b expression at 25 hpf, 3 dpf and 5 dpf using antisense RNA probes. Insets show sections of 3 dpf and 5 dpf larvae post in situ hybridization for 5a and 5b expression. 5a and 5b are expressed in all the brain regions during early development and their expression appears to get slightly stronger in the MB at later stages. (G) Section of 3 dpf WTs; α-Slc13a5, α-HuC/D. Insets of dashed box in G showing example of a cell expressing Slc13a5, HuC/D and merged signal. MB neurons express Slc13a5 (Slc13a5+/HuC/D+). (H) Section of 3 dpf WTs; α-Slc13a5, α-Gfap. Insets of dashed box in H showing an example of a cell expressing Slc13a5, Gfap and merged signal. A small population of MB astrocytes express Slc13a5 (Slc13a5+/Gfap+). (I) Section of 3 dpf WTs; α-Slc13a5, α-vGlut1. Insets of dashed box in I showing example of a cell expressing Slc13a5, vGlut1 and merged signal. MB excitatory neurons express Slc13a5 (Slc13a5+/vGlut1+). (J) Section of 3 dpf WTs; α-Slc13a5, α-Gad67. Insets of dashed box in J showing example of a cell expressing Slc13a5, Gad67 and merged signal. MB inhibitory neurons express Slc13a5 (Slc13a5+/Gad67+). (K) Percentage of Slc13a5 + neurons (HuC/D+) and astrocytes (Gfap+) in the MB of 3 dpf WT. There are significantly more Slc13a5+/HuC/D + cells compared to Slc13a5+/Gfap + cells. n = 3 for each group. (L) Nucleotide sequences of 5a in zebrafish WT and 5a−/−. Yellow highlighted regions indicate 11-nucleotide deletion due to mutation in 5a. (M) Nucleotide sequences of 5b in zebrafish WT and 5b−/−. Yellow highlighted regions indicate one-nucleotide substitution followed by 13-nucleotide insertion due to mutation in 5b. (N) Amino acid sequence of 5a in human orthologue, zebrafish WT and 5a−/−. Asterisks indicate conserved amino acids between human and zebrafish. Yellow highlighted regions indicate affected amino acids and premature stop due to mutation in 5a. (O) Amino acid sequence of 5b in human orthologue, zebrafish WT and 5b−/−. Asterisks indicate conserved amino acids between human and zebrafish. Yellow highlighted regions indicate affected amino acids and premature stop due to mutation in 5b. (P-S) WT and slc13a5 mutant larvae at 5 dpf. No morphological differences were observed. WT, n = 5; 5a−/−, n = 5; 5b−/−, n = 5; 5a−/−;5b−/−, n = 5. (T-W) Quantification of FB, MB and HB size at 5 dpf by measuring brain width. MB size is significantly reduced in slc13a5 mutants. FB and HB size is unchanged. WT, n = 5; 5a−/−, n = 6; 5b−/−, n = 6; 5a−/−;5b−/−, n = 7 for FB size measurement. WT, n = 10; 5a−/−, n = 8; 5b−/−, n = 13; 5a−/−;5b−/−, n = 11 for MB size measurement. WT, n = 5; 5a−/−, n = 6; 5b−/−, n = 6; 5a−/−;5b−/−, n = 8 for HB size measurement. Colored lines with arrows on both ends show how the width measurements were performed. (X) Survival curve of WTs and slc13a5 mutants. Very few slc13a5 mutants survive until 30 dpf. WT, n = 78; 5a−/−, n = 40; 5b−/−, n = 28; 5a−/−;5b−/−, n = 92. Data are Mean ± S.D., ns: no significant changes observed, **P ≤ 0.01, ***P ≤ 0.001, ****P ≤ 0.0001- Unpaired t test. hpf, hours post fertilization; dpf, days post fertilization; WT, wild-type siblings; 5a, slc13a5a; 5b, slc13a5b; FB, forebrain; MB, midbrain; HB, hindbrain. The data underlying this figure can be found in S1 Data.
|