|
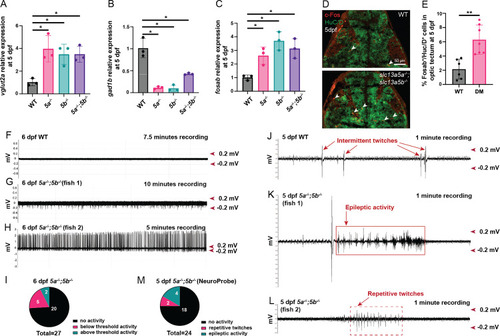
E/I imbalance, fosab expression and brain hyperexcitability analysis in slc13a5 mutants. (A-C) qPCR analysis for relative vglut2a, gad1b and fosab mRNA expression in the heads of 5 dpf slc13a5 mutants compared to WT. WT and slc13a5 mutants, n = 3 × 10 larvae pooled. vglut2a is upregulated and gad1b is downregulated in slc13a5 mutants indicating dysfunctional E/I balance. fosab is upregulated in slc13a5 mutants indicating brain hyperexcitability. (D, E) 5 dpf WTs and slc13a5 mutants; α-HuC/D (green), c-Fos (red). Percentage of Fosab+/HuC/D + cells (out of total HuC/D + cells) in the optic tectum at 5 dpf. slc13a5 mutants show an increase in Fosab + neuron population compared to WTs. WT, n = 6; 5a−/−;5b−/−, n = 7. (F-I) Representative extracellular recordings obtained from optic tectum of 6 dpf WTs and slc13a5 mutants, and a pie chart of the number of slc13a5 mutants showing different patterns of extracellular field potentials. The repetitive inter-ictal like discharges (<1s duration) with above threshold (>0.2mV), high-frequency, large-amplitude spikes seen in 7.4% 5a−/−;5b−/− larvae are indicative of increased network hyperexcitability. 18.5% 5a−/−;5b−/− larvae also displayed below threshold (<0.2mV) brain activity. WT, n = 8 out of 8 with no abnormal activity. (J-M) Representative extracellular recordings obtained using a NeuroProbe placed in the optic tectum of 5 dpf WTs and 5a−/−;5b−/− larvae, and a pie chart of number of 5a−/−;5b−/− larvae showing different patterns of neuronal activity. 91.7% WTs and 100% 5a−/−;5b−/− larvae intermittently twitched (as indicated by red arrows in J) but the deflections were distinguishable from epileptic activities. 16.7% 5a−/−;5b−/− larvae showed epileptic pattern consisting of a series of short bursts, with a total duration of> 10s (as shown by red arrows in K) and 8.3% 5a−/−;5b−/− larvae showed repetitive twitches (>5s) at consistent frequency of ~ 1.8 Hz (as shown by red arrows in L), another indication of seizures. WT, n = 12 out of 12 with no abnormal activity. Data are Mean ± S.D., * P ≤ 0.05, **P ≤ 0.01- Unpaired t test. The data underlying this figure can be found in S1 Data.
|