|
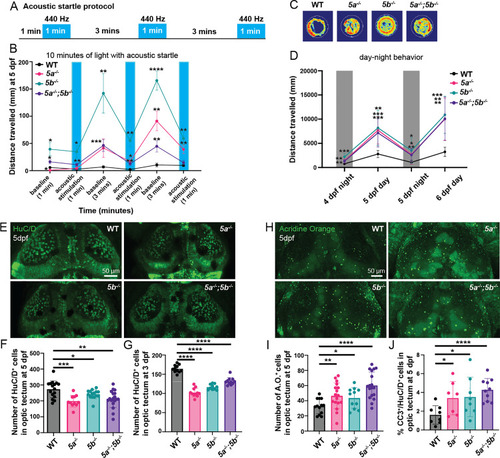
Analysis of startle response and circadian disturbances in slc13a5 mutants, along with their neuron population and neuronal apoptosis assessment. (A) Schematic representation of acoustic startle protocol. (B) Quantification of distance traveled during baseline and acoustic stimulation periods at 5 dpf. slc13a5 mutants are hyperactive in light without any external stimuli and are more responsive to startle, with significantly higher distance traveled during baseline and acoustic stimulation periods compared to WT. WT, n = 21; 5a−/−, n = 8; 5b−/−, n = 8; 5a−/−;5b−/−, n = 24. ‘ns’ values are not shown on the graph due to space constraints. (C) Heat maps of locomotion of larvae at 5 dpf under acoustic startle, showing that slc13a5 mutants are more active than WTs (red shows highest presence and blue shows least presence). WT, n = 4; 5a−/−, n = 4; 5b−/−, n = 4; 5a−/−;5b−/−, n = 4. (D) Quantification of distance traveled in 10 hours of darkness in night at 4 dpf, 6 hours of light in the daytime at 5 dpf, 10 hours of darkness in night at 5 dpf and 6 hours of light in the daytime at 6 dpf. slc13a5 mutants are more active than WTs in light as well as in darkness. WT, n = 10; 5a−/−, n = 10; 5b−/−, n = 10; 5a−/−;5b−/−, n = 10 for each time point. (E) 5 dpf WTs and slc13a5 mutants; α-HuC/D (green). (F) Quantification of HuC/D + cells in the optic tectum at 5 dpf. slc13a5 mutants show a reduction in neuron numbers compared to WTs. WT, n = 16; 5a−/−, n = 11; 5b−/−, n = 15; 5a−/−;5b−/−, n = 18. (G) Quantification of HuC/D + cells in the optic tectum at 3 dpf. slc13a5 mutants show a reduction in neuron numbers compared to WTs. WT, n = 11; 5a−/−, n = 11; 5b−/−, n = 10; 5a−/−;5b−/−, n = 11. (H) Live 5 dpf slc13a5 mutants and WTs, stained with A.O. (green). (I) Quantification of A.O. + cells in the optic tectum at 5 dpf. slc13a5 mutants show an increase in A.O. + cell numbers compared to WTs. WT, n = 13; 5a−/−, n = 17; 5b−/−, n = 11; 5a−/−;5b−/−, n = 18. (J) Percentage of CC3+/HuC/D + cells (out of total HuC/D + cells) in the optic tectum at 5 dpf. slc13a5 mutants show an increase in CC3 + neuron population compared to WTs. WT, n = 8; 5a−/−, n = 7; 5b−/−, n = 8; 5a−/−;5b−/−, n = 10. Data are Mean ± S.D., * P ≤ 0.05, **P ≤ 0.01, ***P ≤ 0.001, ****P ≤ 0.0001- Unpaired t test. A.O., acridine orange; CC3, cleaved-Caspase3. The data underlying this figure can be found in S1 Data.
|