|
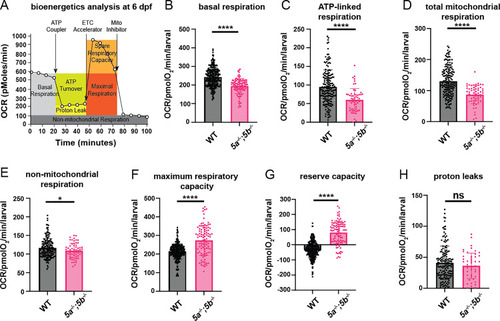
Metabolic health analysis in slc13a5 mutants. (A) Schematic representation of how the Seahorse bioanalyzer displays mitochondrial bioenergetics being regulated by pharmacological inhibitors. (B) Quantification of basal respiration at 6 dpf. slc13a5 mutants exhibit a significant reduction in basal respiration compared to WT. WT, n = 58; slc13a5 mutants, n = 20 (individual values plotted from five cycles). (C) Quantification of ATP-linked respiration at 6 dpf. slc13a5 mutants exhibit a significant reduction in ATP-linked respiration compared to WT. WT, n = 59; slc13a5 mutants, n = 20 (individual values plotted from three cycles). (D) Quantification of total mitochondrial respiration at 6 dpf. slc13a5 mutants exhibit a significant reduction in total mitochondrial respiration compared to WT. WT, n = 59; slc13a5 mutants, n = 20 (individual values plotted from three cycles). (E) Quantification of non-mitochondrial respiration at 6 dpf. slc13a5 mutants exhibit a significant reduction in non-mitochondrial respiration compared to WT. WT, n = 59; slc13a5 mutants, n = 20 (individual values plotted from three cycles). (F) Quantification of maximum respiratory capacity at 6 dpf. slc13a5 mutants exhibit a significant increase in maximum respiratory capacity compared to WT. WT, n = 59; slc13a5 mutants, n = 20 (individual values plotted from five cycles). (G) Quantification of reserve capacity at 6 dpf. slc13a5 mutants exhibit a significant increase in reserve capacity compared to WT. WT, n = 59; slc13a5 mutants, n = 20 (individual values plotted from five cycles). (H) Quantification of proton leaks at 6 dpf. This parameter was unchanged in slc13a5 mutants compared to WT. WT, n = 32; slc13a5 mutants, n = 10 (individual values plotted from five cycles). Data are Mean ± S.D., ns: no significant changes observed, * P ≤ 0.05, ****P ≤ 0.0001- Unpaired t test. The data underlying this figure can be found in S1 Data.
|