FIGURE SUMMARY
Title

Amyloid-β Dysregulates Oligodendroglial Lineage Cell Dynamics and Myelination via PKC in the Zebrafish Spinal Cord

Authors
Balantzategi, U., Gaminde-Blasco, A., Kearns, C.A., Bayón-Cordero, L., Sánchez-Gómez, M.V., Zugaza, J.L., Appel, B., Alberdi, E.
Source
Full text @ Glia

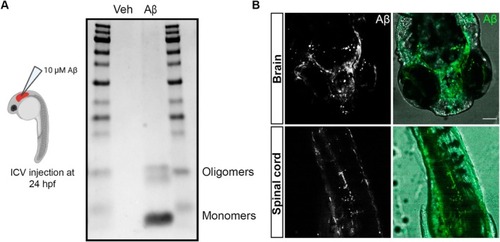
Intracerebroventricular Aβ injection into zebrafish larvae. (A) Schematic representation of the experimental approach, and the detection of Aβ species (monomers and oligomers) in the injection mixtures of vehicle and Aβ using Coomassie blue staining. (B) Representative images of fluorescent‐labeled Aβ diffusion into the brain and spinal cord of 24 hpf zebrafish larvae following ICV injection. Scale bar = 50 μm.

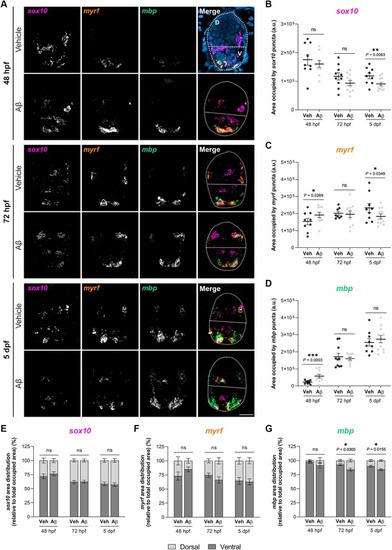
Aβ‐injected zebrafish larvae exhibit alterations in oligodendroglial lineage mRNA levels and regional distribution in the developing spinal cord. Zebrafish larvae were injected with Aβ or its vehicle at 24 hpf, and FISH assays were performed for sox10, myrf and mbp at 48 hpf, 72 hpf and 5 dpf. (A) Representative confocal images of spinal cord cross‐sections depicting mRNA expression fluorescence. Dorsal and ventral regions were defined based on the DAPI (blue) pattern, and are delineated by the dotted white line. (B–D) RNAscope analysis representing the total area occupied by each mRNA in the developing spinal cord. (E–G) Quantification of the regional distribution of each mRNA in the ventral and dorsal regions, expressed relative to the total occupied area. Scale bar = 20 μm. Data are represented as means ± SEM, *p < 0.05, **p < 0.01, ***p < 0.001 compared to vehicle‐injected zebrafish larvae. Statistical significance was drawn by two‐tailed nested t‐test and two‐way ANOVA, followed by Sidak's post hoc test. n = 8–11 larvae per condition and time point.

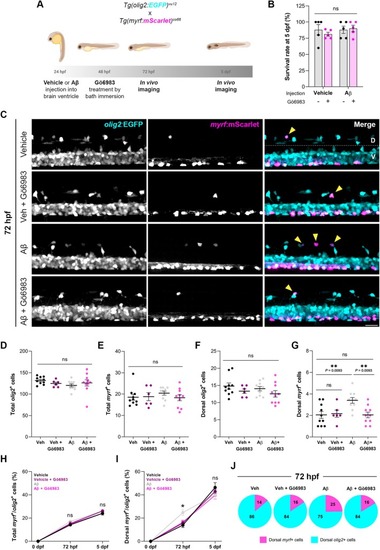
Aβ induces early oligodendrocyte differentiation through PKC, without affecting total cell numbers. (A) Transgenic zebrafish stably expressing olig2:EGFP and myrf:MScarlet were injected with Aβ or its vehicle at 24 hpf, and treated with Gö6983 (500 nM) at 48 hpf by bath immersion. Live imaging was performed at 72 hpf and 5 dpf. (B) Survival rate was measured at 5 dpf. (C) Representative lateral fluorescence images of the spinal cord in live transgenic larvae at 72 hpf. Yellow arrowheads indicate olig2+myrf+ cells. Dorsal and ventral regions are delineated by the dotted white line. (D) Graphs comparing the number of total olig2+ cells, (E) total myrf+ cells, (F) dorsal olig2+ cells, and (G) dorsal myrf+ cells. (H) Graphs showing the progression of differentiating OLs (myrf+/olig2+ cells) in the total and (I) dorsal spinal cord. (J) Pie charts showing the ratio of differentiating dorsal OLs at 72 hpf for each condition. Scale bar = 20 μm. Data indicate means ± SEM, and dots represent individual larvae. *p < 0.05; Statistical significance was determined by two‐way ANOVA and mixed‐effects analysis followed by Tukey's post hoc. n72 hpf = 6–10 larvae per condition; n5 dpf = 7–9 larvae per condition.

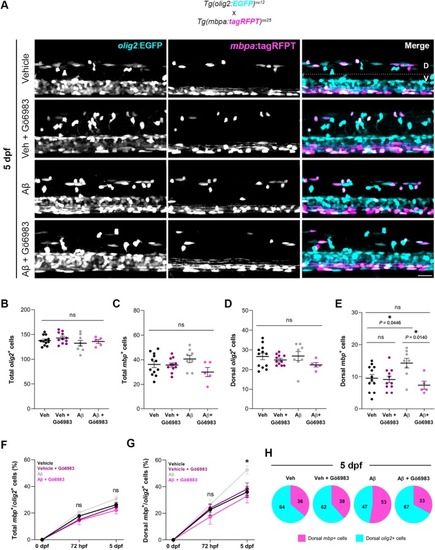
Aβ promotes oligodendrocyte maturation via PKC, without changing total cell numbers. (A) Representative lateral images of the spinal cord of live transgenic larvae stably expressing olig2:EGFP and mbpa:TagRFPT, at 5 dpf. Dorsal and ventral regions are delineated by the dotted white line. (B) Graphs comparing the quantity of total olig2+ cells, (C) total mbp+ cells, (D) dorsal olig2+ cells, and (E) dorsal mbp+ cells. (F) Graphical representation of the progression of maturing mbp+ OLs (mbp+/olig2+ cells) throughout development in the total and (G) dorsal spinal cord. (H) Pie charts showing the percentages of dorsal mature OLs at 5 dpf. Scale bar = 20 μm. Data indicate means ± SEM, and dots represent individual larvae. *p < 0.05; Statistical significance was drawn by two‐way ANOVA and mixed‐effects analysis followed by Tukey's post hoc. n72 hpf = 6–12 larvae per condition; n5 dpf = 5–12 larvae per condition.

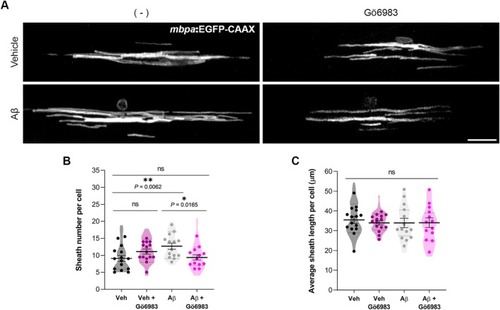
Aβ dysregulates dorsal myelin sheath number per oligodendrocyte via PKC activation. The mbpa:EGFP‐CAAX plasmid was injected into zebrafish embryos at the 1‐cell stage, followed by the administration of 10 μM of Aβ or its vehicle into the hindbrain ventricle of zebrafish larvae at 24 hpf. 500 nM Gö6983 treatments were performed at 48 hpf, and live imaging of myelin sheaths was performed at 5 dpf. (A) Representative fluorescent images of OLs in the spinal cord of live zebrafish larvae. (B) Histograms illustrating the sheath number per cell and (C) the average individual sheath length. Scale bar = 20 μm. Data are presented as means ± SEM; dots represent individual larvae and violin plots quantification of individual cells. *p < 0.05, **p < 0.01; Statistical significance was determined by two‐way ANOVA followed by Sidak's post hoc. n = 13–15 larvae per condition.

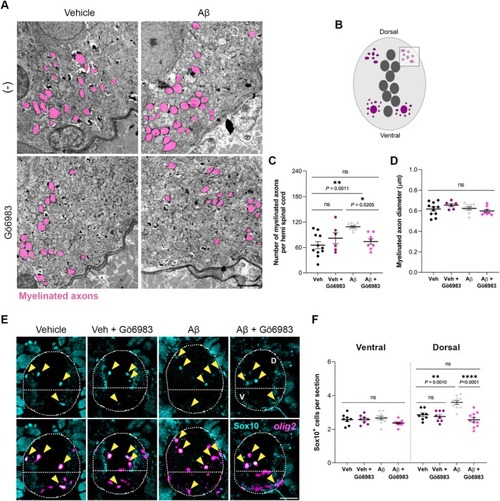
Aβ increases the number of dorsal oligodendroglial lineage cells and myelinated axons through PKC. Zebrafish larvae were intracerebroventricularly injected with Aβ (10 μM) or its vehicle at 24 hpf, and some were exposed to Gö6983 (500 nM) at 48 hpf. Larvae were fixed for electron microscopy or immunohistochemistry at 8 dpf. (A) Representative electron micrographs of the dorsal spinal cord of 8 dpf zebrafish larvae, with myelinated axons shaded in pink. (B) Schematic illustration of a cross‐section of the zebrafish spinal cord. The square represents the analyzed area. Histograms showing the (C) number and (D) diameter of myelinated axons in the dorsal area for each condition. Scale bar = 2 μm. n = 6–11 larvae per condition. (E) Representative transverse sections of olig2:EGFP (magenta) larvae spinal cords processed for immunohistochemistry to detect Sox10 expression (cyan; yellow arrowheads). Dashed white line indicates the outer edge of the spinal cord and dorsal and ventral areas. (F) Quantification of Sox10+ cells in the ventral and dorsal spinal cord at 8 dpf. Scale bar = 20 μm. n = 8—11larvae per condition. Data indicate means ± SEM, with dots representing individual larvae. *p < 0.05, **p < 0.01, ****p < 0.0001. Statistical significance was determined by two‐way ANOVA followed by Sidak's and Tukey's post hoc tests.

Acknowledgments
This image is the copyrighted work of the attributed author or publisher, and ZFIN has permission only to display this image to its users. Additional permissions should be obtained from the applicable author or publisher of the image. Full text @ Glia