FIGURE

FIGURE 3

ID
ZDB-FIG-250530-107
Publication
Balantzategi et al., 2025 - Amyloid-β Dysregulates Oligodendroglial Lineage Cell Dynamics and Myelination via PKC in the Zebrafish Spinal Cord
Other Figures
All Figure Page
Back to All Figure Page
FIGURE 3

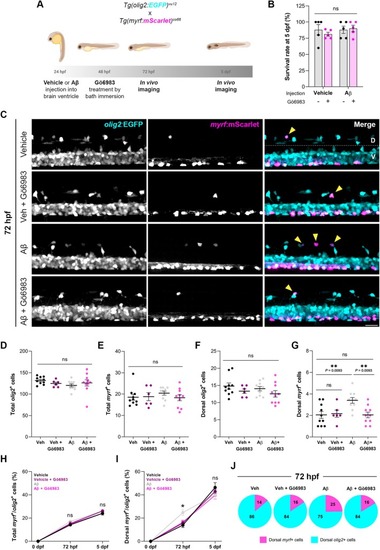
Aβ induces early oligodendrocyte differentiation through PKC, without affecting total cell numbers. (A) Transgenic zebrafish stably expressing olig2:EGFP and myrf:MScarlet were injected with Aβ or its vehicle at 24 hpf, and treated with Gö6983 (500 nM) at 48 hpf by bath immersion. Live imaging was performed at 72 hpf and 5 dpf. (B) Survival rate was measured at 5 dpf. (C) Representative lateral fluorescence images of the spinal cord in live transgenic larvae at 72 hpf. Yellow arrowheads indicate olig2+myrf+ cells. Dorsal and ventral regions are delineated by the dotted white line. (D) Graphs comparing the number of total olig2+ cells, (E) total myrf+ cells, (F) dorsal olig2+ cells, and (G) dorsal myrf+ cells. (H) Graphs showing the progression of differentiating OLs (myrf+/olig2+ cells) in the total and (I) dorsal spinal cord. (J) Pie charts showing the ratio of differentiating dorsal OLs at 72 hpf for each condition. Scale bar = 20 μm. Data indicate means ± SEM, and dots represent individual larvae. *p < 0.05; Statistical significance was determined by two‐way ANOVA and mixed‐effects analysis followed by Tukey's post hoc. n72 hpf = 6–10 larvae per condition; n5 dpf = 7–9 larvae per condition.

Expression Data

Expression Detail
Antibody Labeling
Phenotype Data

Phenotype Detail
Acknowledgments
This image is the copyrighted work of the attributed author or publisher, and ZFIN has permission only to display this image to its users. Additional permissions should be obtained from the applicable author or publisher of the image. Full text @ Glia