IMAGE

FIGURE 4

ID
ZDB-IMAGE-250530-107
Source
Figures for Balantzategi et al., 2025
Image
Figure Caption

FIGURE 4

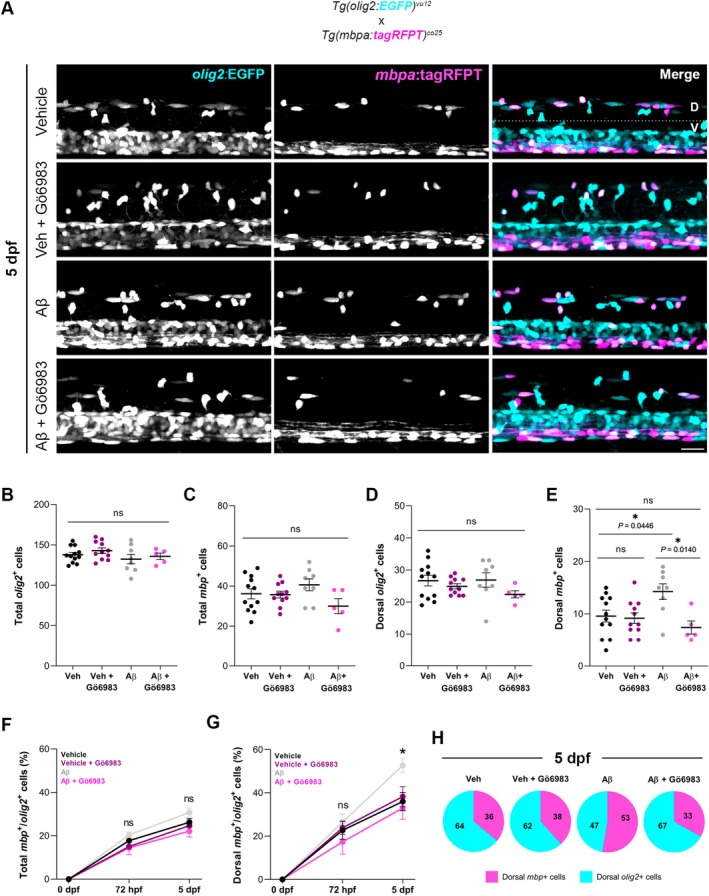
Aβ promotes oligodendrocyte maturation via PKC, without changing total cell numbers. (A) Representative lateral images of the spinal cord of live transgenic larvae stably expressing olig2:EGFP and mbpa:TagRFPT, at 5 dpf. Dorsal and ventral regions are delineated by the dotted white line. (B) Graphs comparing the quantity of total olig2+ cells, (C) total mbp+ cells, (D) dorsal olig2+ cells, and (E) dorsal mbp+ cells. (F) Graphical representation of the progression of maturing mbp+ OLs (mbp+/olig2+ cells) throughout development in the total and (G) dorsal spinal cord. (H) Pie charts showing the percentages of dorsal mature OLs at 5 dpf. Scale bar = 20 μm. Data indicate means ± SEM, and dots represent individual larvae. *p < 0.05; Statistical significance was drawn by two‐way ANOVA and mixed‐effects analysis followed by Tukey's post hoc. n72 hpf = 6–12 larvae per condition; n5 dpf = 5–12 larvae per condition.

Acknowledgments
This image is the copyrighted work of the attributed author or publisher, and ZFIN has permission only to display this image to its users. Additional permissions should be obtained from the applicable author or publisher of the image. Full text @ Glia