FIGURE

FIGURE 6

ID
ZDB-FIG-250530-112
Publication
Balantzategi et al., 2025 - Amyloid-β Dysregulates Oligodendroglial Lineage Cell Dynamics and Myelination via PKC in the Zebrafish Spinal Cord
Other Figures
All Figure Page
Back to All Figure Page
FIGURE 6

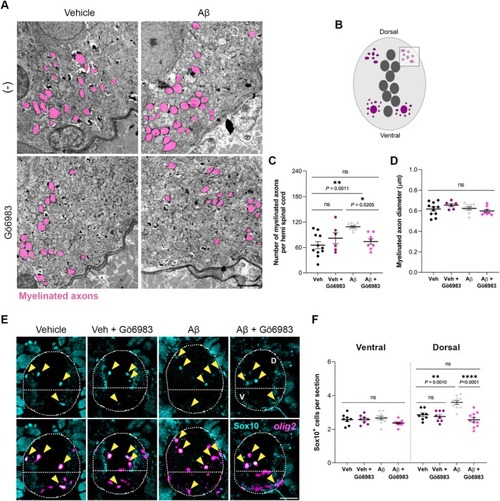
Aβ increases the number of dorsal oligodendroglial lineage cells and myelinated axons through PKC. Zebrafish larvae were intracerebroventricularly injected with Aβ (10 μM) or its vehicle at 24 hpf, and some were exposed to Gö6983 (500 nM) at 48 hpf. Larvae were fixed for electron microscopy or immunohistochemistry at 8 dpf. (A) Representative electron micrographs of the dorsal spinal cord of 8 dpf zebrafish larvae, with myelinated axons shaded in pink. (B) Schematic illustration of a cross‐section of the zebrafish spinal cord. The square represents the analyzed area. Histograms showing the (C) number and (D) diameter of myelinated axons in the dorsal area for each condition. Scale bar = 2 μm. n = 6–11 larvae per condition. (E) Representative transverse sections of olig2:EGFP (magenta) larvae spinal cords processed for immunohistochemistry to detect Sox10 expression (cyan; yellow arrowheads). Dashed white line indicates the outer edge of the spinal cord and dorsal and ventral areas. (F) Quantification of Sox10+ cells in the ventral and dorsal spinal cord at 8 dpf. Scale bar = 20 μm. n = 8—11larvae per condition. Data indicate means ± SEM, with dots representing individual larvae. *p < 0.05, **p < 0.01, ****p < 0.0001. Statistical significance was determined by two‐way ANOVA followed by Sidak's and Tukey's post hoc tests.

Expression Data

Expression Detail
Antibody Labeling
Phenotype Data

Phenotype Detail
Acknowledgments
This image is the copyrighted work of the attributed author or publisher, and ZFIN has permission only to display this image to its users. Additional permissions should be obtained from the applicable author or publisher of the image. Full text @ Glia