FIGURE

FIGURE 2

ID
ZDB-FIG-250530-106
Publication
Balantzategi et al., 2025 - Amyloid-β Dysregulates Oligodendroglial Lineage Cell Dynamics and Myelination via PKC in the Zebrafish Spinal Cord
Other Figures
All Figure Page
Back to All Figure Page
FIGURE 2

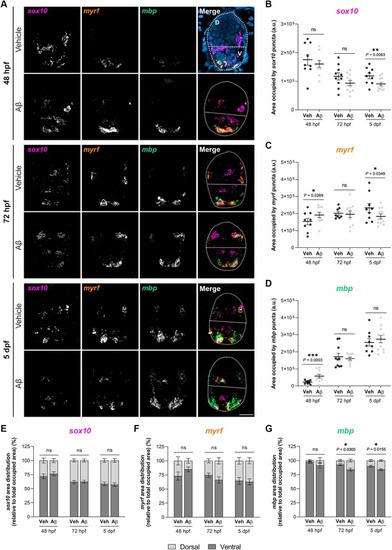
Aβ‐injected zebrafish larvae exhibit alterations in oligodendroglial lineage mRNA levels and regional distribution in the developing spinal cord. Zebrafish larvae were injected with Aβ or its vehicle at 24 hpf, and FISH assays were performed for sox10, myrf and mbp at 48 hpf, 72 hpf and 5 dpf. (A) Representative confocal images of spinal cord cross‐sections depicting mRNA expression fluorescence. Dorsal and ventral regions were defined based on the DAPI (blue) pattern, and are delineated by the dotted white line. (B–D) RNAscope analysis representing the total area occupied by each mRNA in the developing spinal cord. (E–G) Quantification of the regional distribution of each mRNA in the ventral and dorsal regions, expressed relative to the total occupied area. Scale bar = 20 μm. Data are represented as means ± SEM, *p < 0.05, **p < 0.01, ***p < 0.001 compared to vehicle‐injected zebrafish larvae. Statistical significance was drawn by two‐tailed nested t‐test and two‐way ANOVA, followed by Sidak's post hoc test. n = 8–11 larvae per condition and time point.

Expression Data

Expression Detail
Antibody Labeling
Phenotype Data

Phenotype Detail
Acknowledgments
This image is the copyrighted work of the attributed author or publisher, and ZFIN has permission only to display this image to its users. Additional permissions should be obtained from the applicable author or publisher of the image. Full text @ Glia