
Image
|
Figure Caption
FIGURE 1
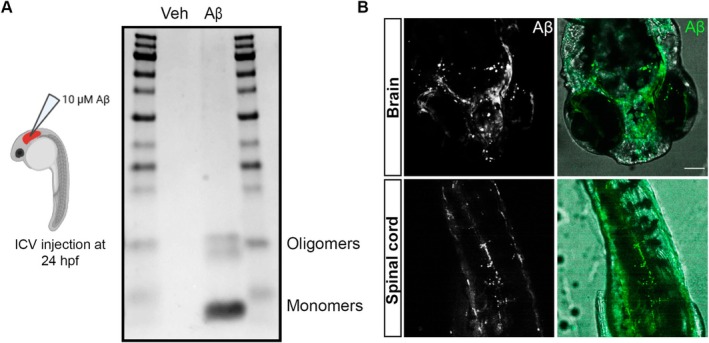
Intracerebroventricular Aβ injection into zebrafish larvae. (A) Schematic representation of the experimental approach, and the detection of Aβ species (monomers and oligomers) in the injection mixtures of vehicle and Aβ using Coomassie blue staining. (B) Representative images of fluorescent‐labeled Aβ diffusion into the brain and spinal cord of 24 hpf zebrafish larvae following ICV injection. Scale bar = 50 μm.
Acknowledgments
This image is the copyrighted work of the attributed author or publisher, and
ZFIN has permission only to display this image to its users.
Additional permissions should be obtained from the applicable author or publisher of the image.
Full text @ Glia