
- Title
-
Toosendanin-induced liver damage through irreparable DNA damage and autophagy flow blockade
- Authors
- Lin, Y., Zhang, J., Gao, X., Wu, Z., Yang, L., Tian, K., Lv, X., Li, J., Chen, K., Zhang, Y., Hu, H., Zhu, A.
- Source
- Full text @ Phytomedicine
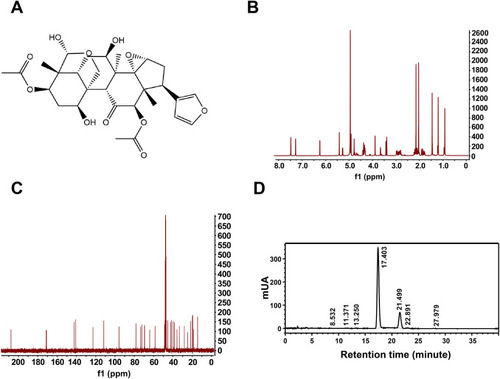
Chemical structure. (A) Chemical construction of TO. (B) 1H and (C) 13C NMR spectra of TO. (D) HPLC analysis revealed that the purity of TO was 98.31 %, with retention times at 11.493 and 14.361 min. |
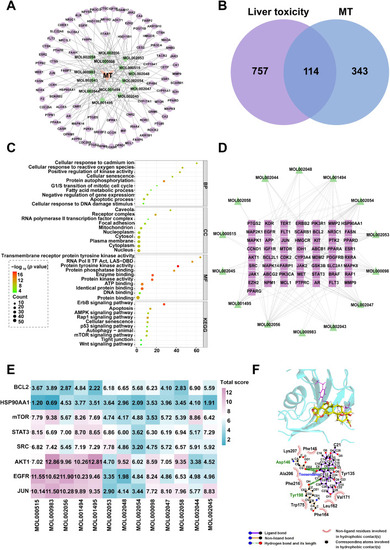
TO network pharmacological results and validation. (A) MT-target network show the active ingredients of MT screened using TCMSP and predicted targets. (B) Venn diagram show the overlap of 114 targets genes of pharmacologically active compounds and liver toxicity relative genes. (C) GO and KEGG enrichment bubble plots. (D) PPI network diagrams of active ingredients and core targets of drugs. (E) Heatmap of the scores of key targets and active compounds of drugs. (F) Visualization of the docking results of the molecular interaction between TO and mTOR. |
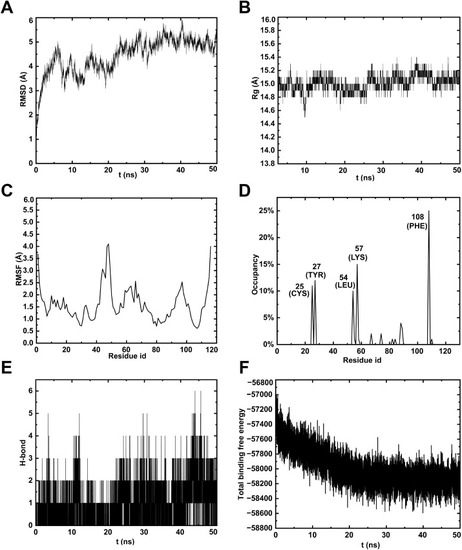
MD simulation of TO-mTOR complex. (A) RMSD analyses demonstrated the stability of mTOR protein and its binding structures with TO. (B) The Rg of complex varies with time. (C) RMSF analyses indicate the binding stability of mTOR protein residues with TO. (D) H-bond occupancy of amino acids within the complexes. (E) Number of hydrogen bonds per ns. (F) Energy changes in the TO-mTOR complex over 50 ns during MD simulations. |
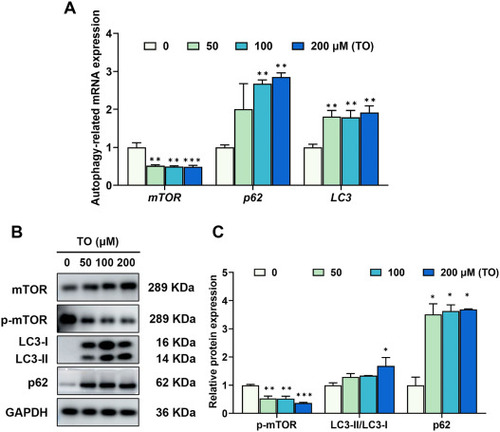
Impact of TO on autophagy after 48 h in HepG2 cells. (A) The autophagy-related genes were analyzed using RT-qPCR. (B) Proteins involved in autophagy were evaluated using western blot analysis. (C) The gray values were quantified using ImageJ (n = 3), *p < 0.05, **p < 0.01, ***p < 0.001. |
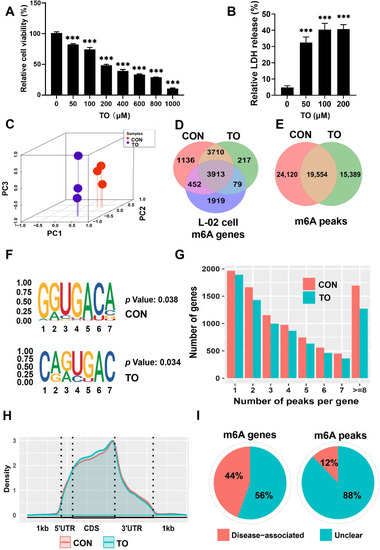
Transcriptome-wide analysis of m6A modifications following 48 h TO exposure in HepG2 cells. (A) MTT assay results demonstrate the relative cell viability following 48 h of TO treatment. (B) Cell LDH leakage levels after TO treatment for 48 h, n = 3, ***p < 0.001. (C) PCA analysis was conducted to demonstrate differentiation between the CON and TO groups. (D) The overlap of m6A genes among CON, TO and L-02 cell groups. (E) The m6A peaks in CON and TO groups. (F) The m6A consensus motif for RRACH. (G) The number of m6A methylation peaks, and (H) the m6A modification peaks' density within mRNA transcripts. (I) The effect of m6A peaks and m6A genes on disease after treatment with TO. |
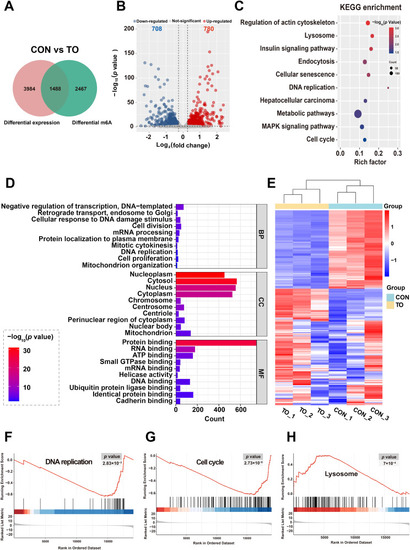
Differentially methylated genes following 48 h TO exposure in HepG2 cells. (A) A total of 1488 overlapping differentially methylated genes were found with p < 0.05 and |log2(fold change)| >0.263. (B) Volcano plot analysis, (C) KEGG enrichment, and (D) GO enrichment were performed on the differentially methylated genes between the CON and TO groups. (E) The heat map shows the differentially methylated genes related to DNA replication, cell cycle, lysosome, cellular senescence, and metabolic pathway in the CON and TO groups. GSEA analysis highlights specific trends in (F) DNA replication, (G) cell cycle, and (H) lysosome following TO treatment. |
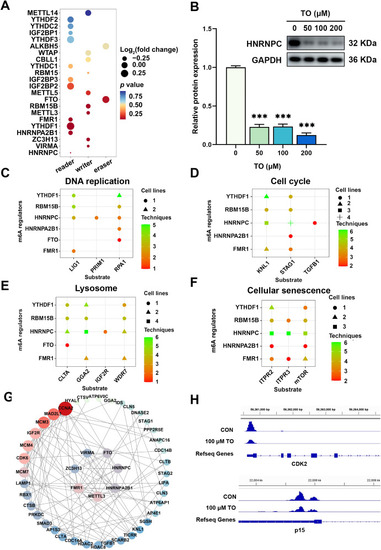
Regulatory analysis of RNA m6A methylation following 48 h TO exposure in HepG2 cells. (A) The p value and log2(fold change) of m6A regulators are presented, along with (B) western blot analysis of HNRNPC. Potential substrates of these regulators including genes related to (C) DNA replication, (D) cell cycle, (E) lysosome, and (F) cellular senescence. (G) A PPI network illustrates the regulatory relationships among these genes. (H) IGV analysis demonstrates a reduction in m6A methylation in CDK2 and p15 (n = 3), ***p < 0.001. |
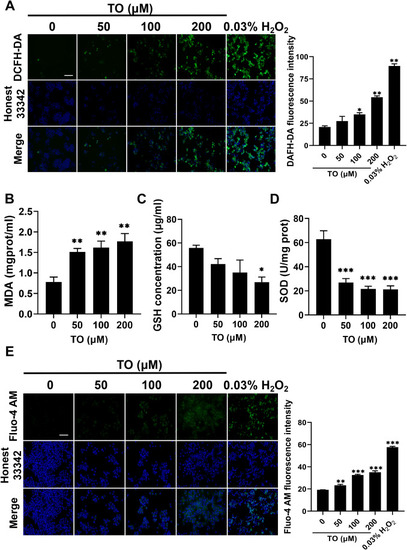
Oxidative stress and calcium overload after 48 h TO exposure in HepG2 cells. (A) Fluorescence images and quantitative results of ROS detected using DCFH-DA probe. Intracellular (B) MDA, (C) GSH, (D) SOD detected using assay kits. (E) Fluorescence images and quantitative results of Ca2+ detected using Fluo-4 AM. n = 3, *p < 0.05, **p < 0.01, ***p < 0.001. |

TO induced mitochondrial damage after 48 h TO exposure in HepG2 cells. (A) Fluorescence images and quantitative results of (A) mPTP and (B) MMP detected using JC-10 probe. (C) Fluorescence images and quantitative results of mitochondrial activity detected using mito-tracker red CMXRos probe. Data are expressed as mean ± SEM for each group, n = 3, ***p < 0.001, scale bar =5 μm. |
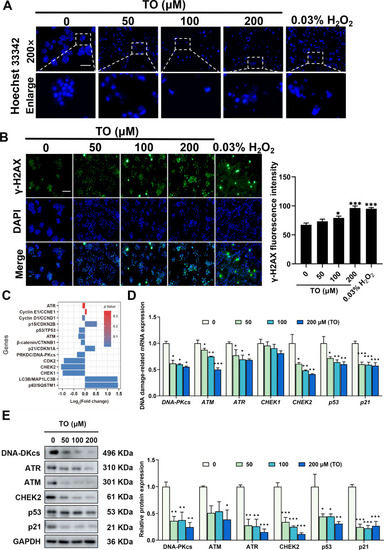
Impact of TO on DDRs in HepG2 cells following 48 h exposure. (A) Hoechst 33342 staining was performed to visualize nuclear fragments. (B) Fluorescence images and intensity of γ-H2AX. Relative mRNA expression level was assessed using (C) mRNA-seq and (D) RT-qPCR. (E) Relative proteins expression and the gray values quantified using ImageJ. Data are presented as mean ± SEM for each group, n = 3, *p < 0.05, **p < 0.01, and ***p < 0.001, scale bar =5 μm. |
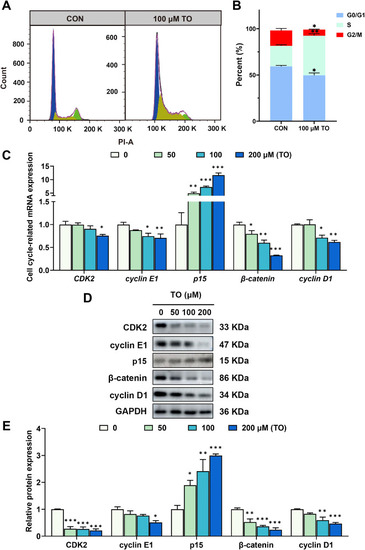
TO induces G1/S phase arrest in HepG2 cells after 48 h treatment. (A) Cell cycle progression was detected using flow cytometry, and (B) calculated using Flowjo and ImageJ. (C) The mRNA level of cell cycle-relative genes in HepG2 cells were detected using RT-qPCR. (D) The protein levels were evaluated using western blot analysis, and (E) the blot density was quantified with ImageJ. Data are expressed as mean ± SEM for each group, n = 3, *p < 0.05, **p < 0.01, and ***p < 0.001. |
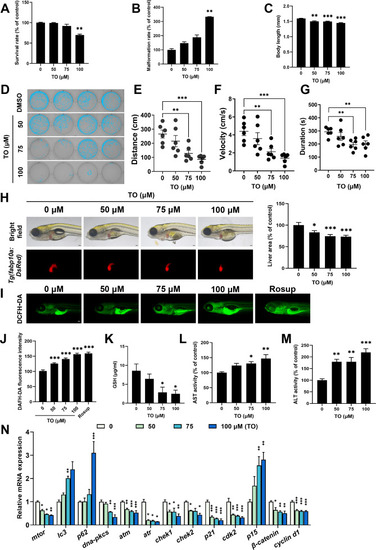
Hepatotoxicity induced by TO following 72 h in vivo. (A) Survival rate, (B) malformation rate of zebrafish larvae. (C) Body length of zebrafish larvae, n = 15. (D) The locomotor behavior of zebrafish larvae was assessed. Statistical findings for (E) locomotor distance, (F) velocity, and (G) movement duration, n = 6. (H) Fluorescence images and quantitative results of zebrafish larvae liver, n = 13. (I) Fluorescence images and (J) quantitative results of ROS level, n = 15. (K) GSH, (L) AST and (M) ALT levels after 72 h. (N) Relative genes expression in zebrafish larvae, n = 3. Data are expressed as mean ± SEM for each group *p < 0.05, **p < 0.01, ***p < 0.001, scale bar =5 μm. |
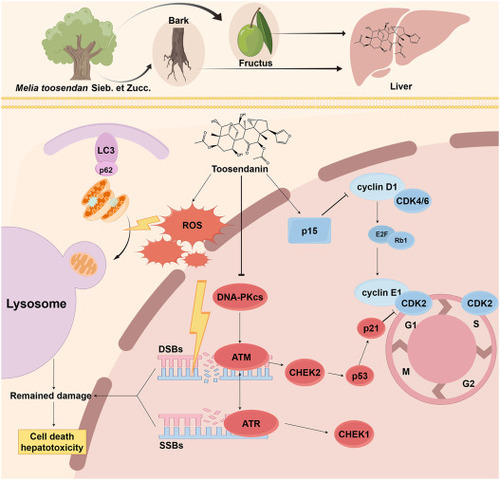
Illustration of the signaling pathway related to the molecular mechanisms of TO toxicity. |
Reprinted from Phytomedicine : international journal of phytotherapy and phytopharmacology, 140, Lin, Y., Zhang, J., Gao, X., Wu, Z., Yang, L., Tian, K., Lv, X., Li, J., Chen, K., Zhang, Y., Hu, H., Zhu, A., Toosendanin-induced liver damage through irreparable DNA damage and autophagy flow blockade, 156586156586, Copyright (2025) with permission from Elsevier. Full text @ Phytomedicine