
FIGURE
Fig. 8
Fig. 8
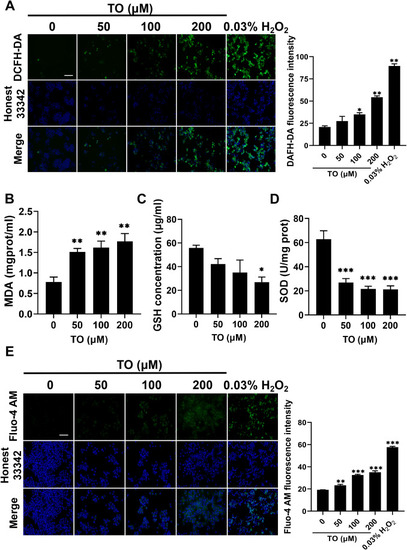
Oxidative stress and calcium overload after 48 h TO exposure in HepG2 cells. (A) Fluorescence images and quantitative results of ROS detected using DCFH-DA probe. Intracellular (B) MDA, (C) GSH, (D) SOD detected using assay kits. (E) Fluorescence images and quantitative results of Ca2+ detected using Fluo-4 AM. n = 3, *p < 0.05, **p < 0.01, ***p < 0.001. |
Expression Data
Expression Detail
Antibody Labeling
Phenotype Data
Phenotype Detail
Acknowledgments
This image is the copyrighted work of the attributed author or publisher, and
ZFIN has permission only to display this image to its users.
Additional permissions should be obtained from the applicable author or publisher of the image.
Reprinted from Phytomedicine : international journal of phytotherapy and phytopharmacology, 140, Lin, Y., Zhang, J., Gao, X., Wu, Z., Yang, L., Tian, K., Lv, X., Li, J., Chen, K., Zhang, Y., Hu, H., Zhu, A., Toosendanin-induced liver damage through irreparable DNA damage and autophagy flow blockade, 156586156586, Copyright (2025) with permission from Elsevier. Full text @ Phytomedicine