
FIGURE
Fig. 3
Fig. 3
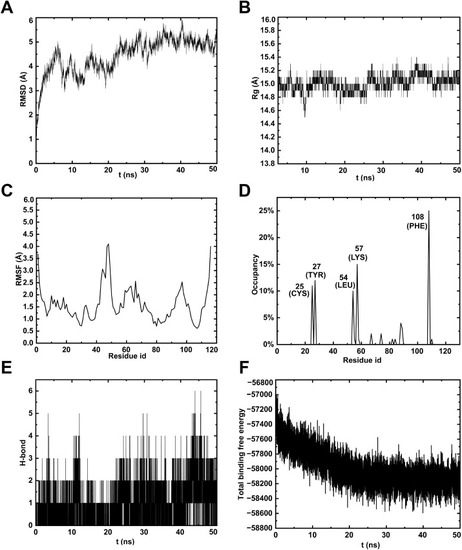
MD simulation of TO-mTOR complex. (A) RMSD analyses demonstrated the stability of mTOR protein and its binding structures with TO. (B) The Rg of complex varies with time. (C) RMSF analyses indicate the binding stability of mTOR protein residues with TO. (D) H-bond occupancy of amino acids within the complexes. (E) Number of hydrogen bonds per ns. (F) Energy changes in the TO-mTOR complex over 50 ns during MD simulations. |
Expression Data
Expression Detail
Antibody Labeling
Phenotype Data
Phenotype Detail
Acknowledgments
This image is the copyrighted work of the attributed author or publisher, and
ZFIN has permission only to display this image to its users.
Additional permissions should be obtained from the applicable author or publisher of the image.
Reprinted from Phytomedicine : international journal of phytotherapy and phytopharmacology, 140, Lin, Y., Zhang, J., Gao, X., Wu, Z., Yang, L., Tian, K., Lv, X., Li, J., Chen, K., Zhang, Y., Hu, H., Zhu, A., Toosendanin-induced liver damage through irreparable DNA damage and autophagy flow blockade, 156586156586, Copyright (2025) with permission from Elsevier. Full text @ Phytomedicine