
FIGURE
Fig. 11
Fig. 11
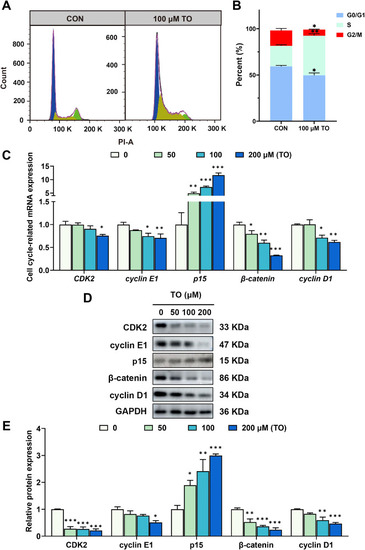
TO induces G1/S phase arrest in HepG2 cells after 48 h treatment. (A) Cell cycle progression was detected using flow cytometry, and (B) calculated using Flowjo and ImageJ. (C) The mRNA level of cell cycle-relative genes in HepG2 cells were detected using RT-qPCR. (D) The protein levels were evaluated using western blot analysis, and (E) the blot density was quantified with ImageJ. Data are expressed as mean ± SEM for each group, n = 3, *p < 0.05, **p < 0.01, and ***p < 0.001. |
Expression Data
Expression Detail
Antibody Labeling
Phenotype Data
Phenotype Detail
Acknowledgments
This image is the copyrighted work of the attributed author or publisher, and
ZFIN has permission only to display this image to its users.
Additional permissions should be obtained from the applicable author or publisher of the image.
Reprinted from Phytomedicine : international journal of phytotherapy and phytopharmacology, 140, Lin, Y., Zhang, J., Gao, X., Wu, Z., Yang, L., Tian, K., Lv, X., Li, J., Chen, K., Zhang, Y., Hu, H., Zhu, A., Toosendanin-induced liver damage through irreparable DNA damage and autophagy flow blockade, 156586156586, Copyright (2025) with permission from Elsevier. Full text @ Phytomedicine