
FIGURE
Fig. 2
Fig. 2
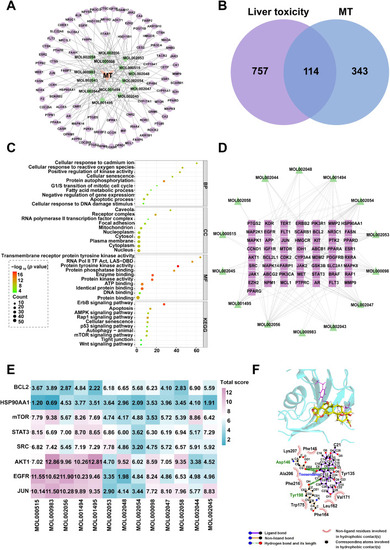
TO network pharmacological results and validation. (A) MT-target network show the active ingredients of MT screened using TCMSP and predicted targets. (B) Venn diagram show the overlap of 114 targets genes of pharmacologically active compounds and liver toxicity relative genes. (C) GO and KEGG enrichment bubble plots. (D) PPI network diagrams of active ingredients and core targets of drugs. (E) Heatmap of the scores of key targets and active compounds of drugs. (F) Visualization of the docking results of the molecular interaction between TO and mTOR. |
Expression Data
Expression Detail
Antibody Labeling
Phenotype Data
Phenotype Detail
Acknowledgments
This image is the copyrighted work of the attributed author or publisher, and
ZFIN has permission only to display this image to its users.
Additional permissions should be obtained from the applicable author or publisher of the image.
Reprinted from Phytomedicine : international journal of phytotherapy and phytopharmacology, 140, Lin, Y., Zhang, J., Gao, X., Wu, Z., Yang, L., Tian, K., Lv, X., Li, J., Chen, K., Zhang, Y., Hu, H., Zhu, A., Toosendanin-induced liver damage through irreparable DNA damage and autophagy flow blockade, 156586156586, Copyright (2025) with permission from Elsevier. Full text @ Phytomedicine