
Fig. 12
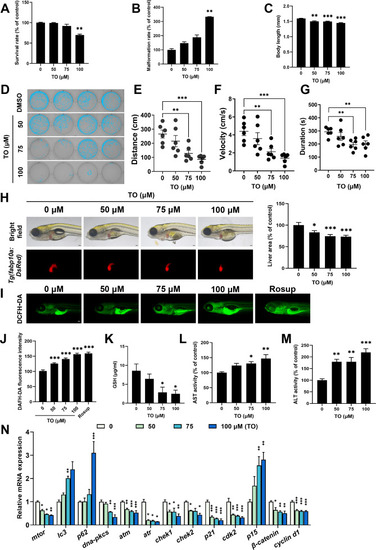
Hepatotoxicity induced by TO following 72 h in vivo. (A) Survival rate, (B) malformation rate of zebrafish larvae. (C) Body length of zebrafish larvae, n = 15. (D) The locomotor behavior of zebrafish larvae was assessed. Statistical findings for (E) locomotor distance, (F) velocity, and (G) movement duration, n = 6. (H) Fluorescence images and quantitative results of zebrafish larvae liver, n = 13. (I) Fluorescence images and (J) quantitative results of ROS level, n = 15. (K) GSH, (L) AST and (M) ALT levels after 72 h. (N) Relative genes expression in zebrafish larvae, n = 3. Data are expressed as mean ± SEM for each group *p < 0.05, **p < 0.01, ***p < 0.001, scale bar =5 μm. |
Reprinted from Phytomedicine : international journal of phytotherapy and phytopharmacology, 140, Lin, Y., Zhang, J., Gao, X., Wu, Z., Yang, L., Tian, K., Lv, X., Li, J., Chen, K., Zhang, Y., Hu, H., Zhu, A., Toosendanin-induced liver damage through irreparable DNA damage and autophagy flow blockade, 156586156586, Copyright (2025) with permission from Elsevier. Full text @ Phytomedicine