
FIGURE
Fig. 7
Fig. 7
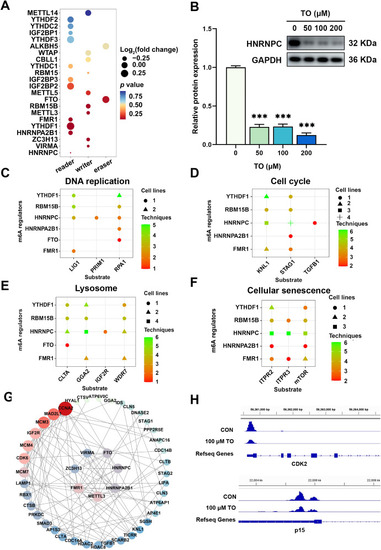
Regulatory analysis of RNA m6A methylation following 48 h TO exposure in HepG2 cells. (A) The p value and log2(fold change) of m6A regulators are presented, along with (B) western blot analysis of HNRNPC. Potential substrates of these regulators including genes related to (C) DNA replication, (D) cell cycle, (E) lysosome, and (F) cellular senescence. (G) A PPI network illustrates the regulatory relationships among these genes. (H) IGV analysis demonstrates a reduction in m6A methylation in CDK2 and p15 (n = 3), ***p < 0.001. |
Expression Data
Expression Detail
Antibody Labeling
Phenotype Data
Phenotype Detail
Acknowledgments
This image is the copyrighted work of the attributed author or publisher, and
ZFIN has permission only to display this image to its users.
Additional permissions should be obtained from the applicable author or publisher of the image.
Reprinted from Phytomedicine : international journal of phytotherapy and phytopharmacology, 140, Lin, Y., Zhang, J., Gao, X., Wu, Z., Yang, L., Tian, K., Lv, X., Li, J., Chen, K., Zhang, Y., Hu, H., Zhu, A., Toosendanin-induced liver damage through irreparable DNA damage and autophagy flow blockade, 156586156586, Copyright (2025) with permission from Elsevier. Full text @ Phytomedicine