FIGURE SUMMARY
Title

Zbtb48 is a regulator of Mtfp1 expression in zebrafish

Authors
Goh, S.Y.C., Fradera-Sola, A., Wittkopp, N., ?erifo?lu, N., Godinho Ferreira, M., Ketting, R.F., Butter, F.
Source
Full text @ Commun Biol

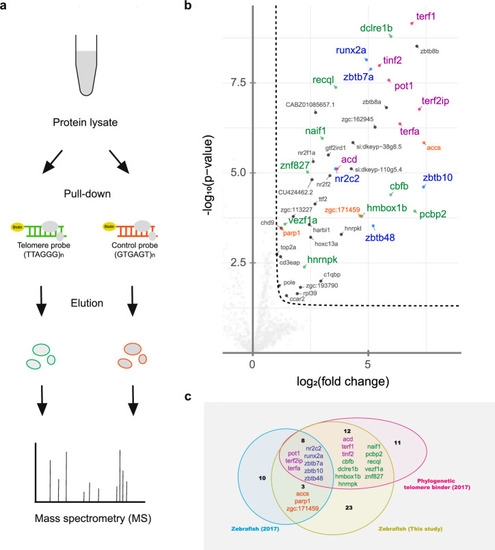
Telomere pull-down with the zebrafish cell line.

a Schematic diagram showing an overview of the telomere pull-down experiment using nuclear lysate from the zebrafish fin fibroblast BRF41 cell line. b Volcano plot visualizing the results obtained by label-free quantification of the bound proteins. The pull-down experiment was conducted in quadruplicate using either concatenated telomeric TTAGGG or a control scrambled GTGAGT oligonucleotide as bait. The results were log-transformed and plotted on the x-axis as log2(fold change) and on the y-axis as -log10(p-value). The protein enrichment threshold was set at a fold change >2 and a p-value < 0.05 (Welch’s t test) with c = 0.05. Enriched proteins were annotated with their gene names and color-coded: shelterin subunits (magenta), proteins that were previously found in the study by Kappei et al. to be enriched in zebrafish (orange), and telomere-binding proteins previously identified as phylogenetically conserved in other species (green), which were also enriched in zebrafish (blue). c Comparison of the previous telomere zebrafish pull-down, the phylogenetic conserved binders and the candidates from the current study.

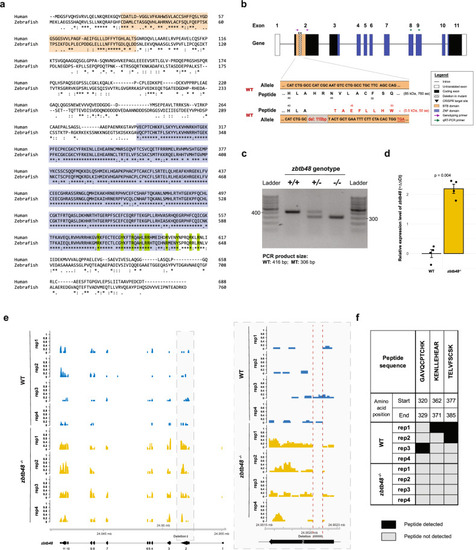
Generation and validation of the zbtb48 CRISPR‒Cas knockout zebrafish line.

a Protein sequence alignment of human ZBTB48 and zebrafish Zbtb48 showing greater homology in the telomere-binding zinc finger domain (80% identity; blue) than in the BTB domain (42% identity; beige). The ten amino acids highlighted in green that are involved in telomere binding activity in humans (Zhao et al.) are conserved in zebrafish. b The zebrafish zbtb48 gene consists of 11 exons (not drawn to scale). To create the zbtb48 CRISPR‒Cas knockout zebrafish line, a pair of guide RNAs was designed to target the second exon, resulting in a 110-base pair frameshift deletion with a premature stop codon. c Results of the genotyping of zbtb48 CRISPR‒Cas knockout zebrafish using agarose gel electrophoresis. d Comparison of zbtb48 mRNA levels between zbtb48−/− mutants and their wild-type counterparts via qRT‒PCR of 5 dpf larvae. The experiment was conducted in biological quadruplicate (25 pooled larvae), each with technical triplicates. Error bars represent the standard error of the mean (SEM), and p-values were calculated using two-tailed Welch’s t test. e mRNA sequencing tracks of the zbtb48 gene region in 5 dpf larvae of wild-type and zbtb48−/− mutant larvae. A magnified image of the boxed area is shown on the right. The CRISPR deletion is marked below the track. f Table showing the Zbtb48 peptides detected via mass spectrometry analysis of a telomere pulldown with lysates extracted from 5 dpf wild-type and zbtb48−/− larvae.

zbtb48−/− fish have no apparent phenotype.

a Table showing the chi-square test results for 500 offspring from eight crosses between zbtb48+/− parents to determine the Mendelian genotype distribution. The test was performed on individual crosses (right) and overall as a group (bottom). For a test of significance at α = 0.05 with 2 degrees of freedom (df), the critical value of the chi-square (X²) is 5.99. b Boxplot showing the percentage of fertilized eggs from second-generation zbtb48−/− mutant males and their wild-type counterparts, both at 1.5-year-old, crossed with wild-type females. Each dot represents a mating setup (n = 6 for zbtb48−/− mutants and n = 5 for wild-type), indicating the percentage of fertilized eggs relative to the total number laid. P-values were calculated using Welch’s t-test. c Photograph of second-generation zbtb48−/− male zebrafish and their wild-type counterparts at 10.5 months of age. The scale bar equals 1 cm. Boxplot for weight (d) and size (e). Measurements were performed on four specimens, and p-values were calculated by Welch’s t test. f Bar plot of the mean telomere length of wild-type and zbtb48−/− mutant fish (n = 3 per genotype) quantified via telomere restriction fragment (TRF) analysis of the caudal fin collected from the first generation of 8-month-old males. Error bars represent the standard error of the mean (SEM), and p-value was determined by an unpaired two-tailed t test (Mann–Whitney).

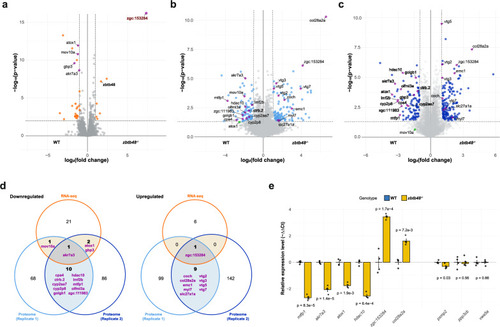
Transcriptomic and proteomic profiling of zbtb48−/− mutants at 5 dpf.

a Volcano plot with quantitative comparison of RNA sequencing (RNA-seq) data from 5 dpf wild-type and zbtb48−/− mutant larvae (n = 4). The results were log-transformed and plotted on the x-axis as log2(fold change) and on the y-axis as -log10(p-value) (Welch’s t test). The transcript enrichment thresholds were set at a fold change > |2| and a p-value < 0.01. Genes annotated in this plot were also differentially expressed in the proteome analysis (b and c). Note: the p-value (4.14e−44) of zgc:153284 is beyond the upper limit of the y-axis. b, c Volcano plots for two biologically independent proteome analyses conducted on pooled 5 dpf wild-type and zbtb48−/− mutant larvae. The results were log-transformed and plotted on the x-axis as log2(fold change) and on the y-axis as -log10(p-value) (Welch’s t test). The protein enrichment threshold was set at a fold change > |2| and a p-value < 0.05. d Venn diagrams showing downregulated (left) and upregulated (right) transcripts or proteins in the zbtb48−/− mutants compared to the wild-type. e qRT‒PCR analysis of selected genes in 5 dpf larvae of wild-type and zbtb48−/− mutant zebrafish. The set includes differentially expressed genes from this study (left) and previously reported human target genes (Jahn et al.) (right). The experiment was conducted in biological quadruplicate (25 pooled larvae) with technical triplicates each. Error bars represent the standard error of the mean (SEM), and p-values were calculated using two-tailed Welch’s t test.

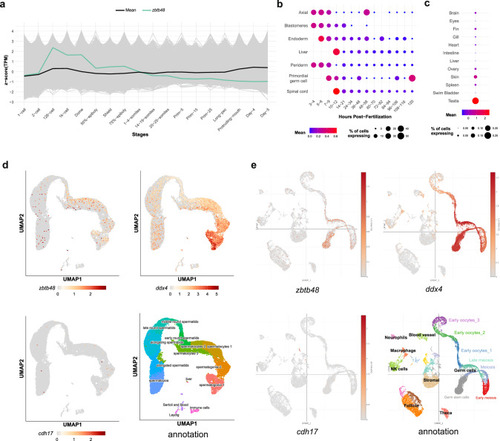
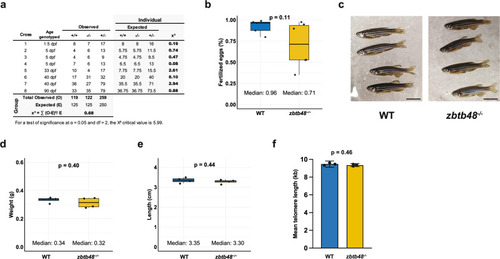
Spatiotemporal expression of
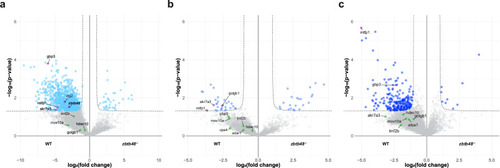
 zbtb48 transcripts in larvae and adults.

a Developmental expression profile with zbtb48 mRNA highlighted (green thick line) in whole larvae replotted from previously published data (White et al.). Heatmap of zbtb48 expression in different tissues during the first five days of development (b) based on data from Farrell et al. and Sur et al. or in adult tissues (c) based on data from Jiang et al. d UMAP plots of single-cell RNA sequencing (scRNA-seq) of testes from 5- to 22-month-old fish. Figures were downloaded from the public website (Sposato et al.). e UMAP plots of scRNA-seq data from ovaries of 40 dpf fish. Figures were downloaded from a public website (Liu et al.). For d and (e), the top left panel shows the zbtb48 mRNA expression level, the top right panel shows ddx4 (also known as vasa, which is highly expressed in germ cells), the bottom left panel shows cdh17 (not expressed in germ cells), and the bottom right panel shows the cell population annotation.

Proteomic analysis of zbtb48−/− gonads.

Volcano plots of the proteome analysis of ovaries from 40 dpf (a), testes from 40 dpf (b) and testes from 10.5-month-old (c) wild-type and zbtb48−/− mutant fish. Biological replicates of 40 dpf ovaries (n = 3) and 40 dpf and 10.5-month-old testes (n = 4) were measured for each genotype. The results were log-transformed and plotted on the x-axis as log2(fold change) and on the y-axis as -log10(p-value) (Welch’s t test). The protein enrichment thresholds were set at a fold change > |2| and a p-value < 0.05. Proteins common to Fig. 4d were annotated.

Acknowledgments
This image is the copyrighted work of the attributed author or publisher, and ZFIN has permission only to display this image to its users. Additional permissions should be obtained from the applicable author or publisher of the image. Full text @ Commun Biol