|
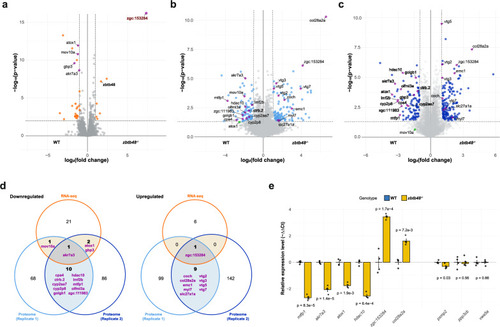
Transcriptomic and proteomic profiling of zbtb48−/− mutants at 5 dpf. a Volcano plot with quantitative comparison of RNA sequencing (RNA-seq) data from 5 dpf wild-type and zbtb48−/− mutant larvae (n = 4). The results were log-transformed and plotted on the x-axis as log2(fold change) and on the y-axis as -log10(p-value) (Welch’s t test). The transcript enrichment thresholds were set at a fold change > |2| and a p-value < 0.01. Genes annotated in this plot were also differentially expressed in the proteome analysis (b and c). Note: the p-value (4.14e−44) of zgc:153284 is beyond the upper limit of the y-axis. b, c Volcano plots for two biologically independent proteome analyses conducted on pooled 5 dpf wild-type and zbtb48−/− mutant larvae. The results were log-transformed and plotted on the x-axis as log2(fold change) and on the y-axis as -log10(p-value) (Welch’s t test). The protein enrichment threshold was set at a fold change > |2| and a p-value < 0.05. d Venn diagrams showing downregulated (left) and upregulated (right) transcripts or proteins in the zbtb48−/− mutants compared to the wild-type. e qRT‒PCR analysis of selected genes in 5 dpf larvae of wild-type and zbtb48−/− mutant zebrafish. The set includes differentially expressed genes from this study (left) and previously reported human target genes (Jahn et al.) (right). The experiment was conducted in biological quadruplicate (25 pooled larvae) with technical triplicates each. Error bars represent the standard error of the mean (SEM), and p-values were calculated using two-tailed Welch’s t test.
|