|
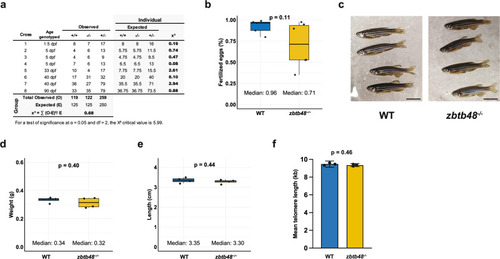
zbtb48−/− fish have no apparent phenotype. a Table showing the chi-square test results for 500 offspring from eight crosses between zbtb48+/− parents to determine the Mendelian genotype distribution. The test was performed on individual crosses (right) and overall as a group (bottom). For a test of significance at α = 0.05 with 2 degrees of freedom (df), the critical value of the chi-square (X²) is 5.99. b Boxplot showing the percentage of fertilized eggs from second-generation zbtb48−/− mutant males and their wild-type counterparts, both at 1.5-year-old, crossed with wild-type females. Each dot represents a mating setup (n = 6 for zbtb48−/− mutants and n = 5 for wild-type), indicating the percentage of fertilized eggs relative to the total number laid. P-values were calculated using Welch’s t-test. c Photograph of second-generation zbtb48−/− male zebrafish and their wild-type counterparts at 10.5 months of age. The scale bar equals 1 cm. Boxplot for weight (d) and size (e). Measurements were performed on four specimens, and p-values were calculated by Welch’s t test. f Bar plot of the mean telomere length of wild-type and zbtb48−/− mutant fish (n = 3 per genotype) quantified via telomere restriction fragment (TRF) analysis of the caudal fin collected from the first generation of 8-month-old males. Error bars represent the standard error of the mean (SEM), and p-value was determined by an unpaired two-tailed t test (Mann–Whitney).
|