FIGURE SUMMARY
Title

Molecularly engineered supramolecular fluorescent chemodosimeter for measuring epinephrine dynamics

Authors
Zhao, Y., Mei, Y., Liu, Z., Sun, J., Tian, Y.
Source
Full text @ Nat. Commun.

The host-guest GMG2 chemodosimeter for visualizing and quantifying of EP in vitro and in vivo.

a The working principle of the developed and optimized CMG2 sensor for specific and rapid determination of EP. b Fluorescence imaging and real-time quantification of EP in cell membrane, brain tissue, and zebrafish. c Schematic diagram of fiber optic construction of multiple brain regions in mice.

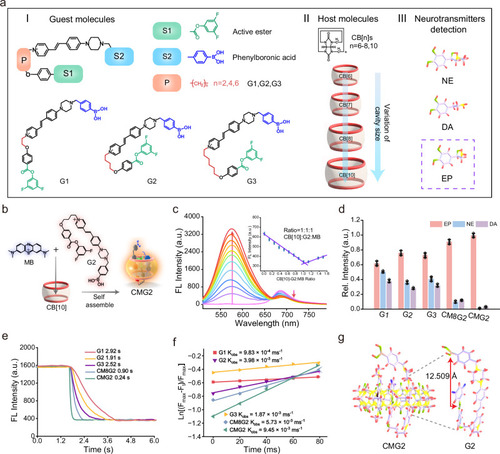
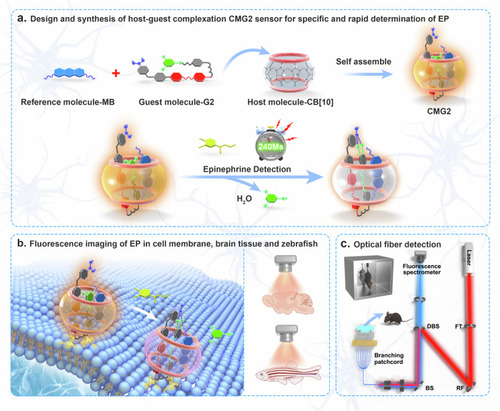
Design and synthesis of host–guest supramolecular fluorescent chemodosimeters for selective and rapid response toward EP.

a Schematics of guest recognition molecules G1–G3 with varies alkyl chain lengths, host molecules CB[n]s with different cavity sizes, and neurotransmitters to be tested. b The self-assembly of the developed and optimized CMG2 supramolecular fluorescent sensor for EP. c Fluorescence titration spectra of MB (10 μm) toward addition of CB10-G2 (concentration ratio, 1:1) with different concentration (0−15 μm) in PBS buffer (10 mm, pH = 7.4) containing 0.05% DMSO; Illustration: CB10-G2 with MB assembled molar ratio. Data are presented as mean ± S.D. Error bars: S.D., n  =  5 independent experiments. d Interference of G1, G2, G3, CM8G2 and CMG2 on NE and DA (Set the response value of CMG2 for EP to 1.0). Data are presented as mean ± S.D. Error bars: S.D., n  =  5 independent experiments. e Kinetic fluorescence responses of the G1–G3 (each 10 μm) and the assembled host-guest supramolecular fluorescent sensor toward addition of 5 μm EP in PBS (10 mm, pH 7.4). f Reaction rate constants (kobs) were measured for the G1–G3 and the assembled host-guest supramolecular fluorescent sensor in response to EP. The pseudo-first-order rate constants (kobs) obtained from the slopes of plot of ln[(Fmax–Ft)/Fmax] vs time. Fmax is the maximum fluorescence intensity during the measurement time, Ft is the fluorescence intensity at the corresponding time points (Fmax, Ft: The fluorescent emission wavelength is 570 nm). g The molecular structure of CMG2 after DFT optimization and the quantification of the distance between two recognition sites of G2. The above-mentioned source data are provided as a Source Data file.

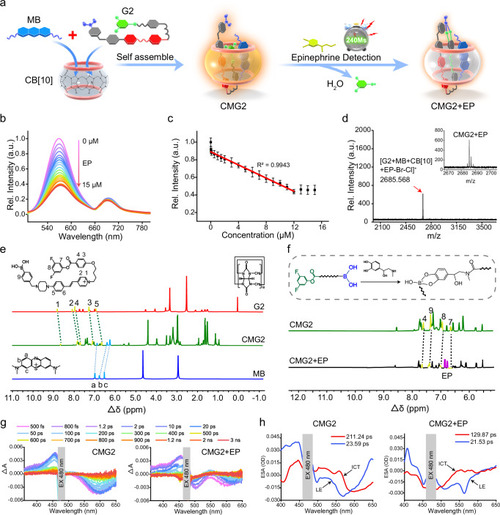
Fluorescence titration of CMG2 toward EP and mechanism evaluation.

a The working principle of the developed and optimized CMG2 for specific and rapid determination of EP. b Fluorescence spectra of 10.0 μm CMG2 with the addition of EP at different concentrations (0– 15 μm) in cell lysis buffer (10 mm, pH = 7.4) containing 0.05% DMSO excited at 480 nm. c Relative fluorescence intensity of the CMG2 versus EP concentration (0–15 μm). Data are presented as mean ± S.D. Error bars: S.D., n  =  5 independent experiments. d Maldi-TOF mass spectrometry of CMG2 + EP. e1HNMR spectra of G2, MB and CMG2 ([G2] = [MB] = [CB10] = [CMG2] = 5 mm). f1HNMR spectra of CMG2 and CMG2 assembled with EP ([CMG2] = [EP] = 5 mm, in DMSO-d6: D2O = 1: 1 at 298 K). g Transient absorption spectroscopy for CMG2 (left), and CMG2 + EP (right). h Principal spectral components from the global analysis of time-resolved absorption spectra from 480 nm excitation for CMG2 (left), and CMG2 + EP (right). The above-mentioned source data are provided as a Source Data file.

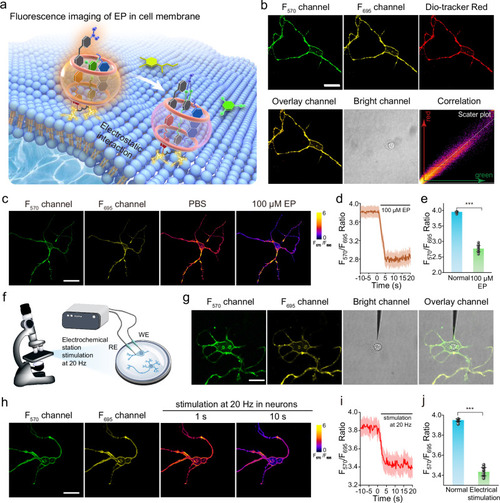
Fluorescence imaging and real-time quantification of EP in neurons.

a Fluorescence imaging and real-time quantification of EP in cell membrane. b Confocal fluorescence images of neurons costained with CMG2 and a commercial membrane probe (Dio). Three independent experiments were repeated and similar results were obtained. Scale bar: 15 μm. c Representative images showing the fluorescence images of CMG2 at cell membrane and their response to 100 μm EP. Scale bar: 15 μm. d Representative traces of CMG2 in response to 100 μm EP. e Dynamic response summary of CMG2 in response to 100 μm EP (n = 15 cells). f Schematic diagram of electrically stimulated neurons. g Confocal fluorescence images of electrically stimulated neurons. Scale bar: 10 μm. h Time-lapse confocal fluorescence images of CMG2-incubated neurons after electrical stimulation. Scale bar: 15 μm. i Representative traces of CMG2 after electrical stimulation (n = 15 cells). j Dynamic response summary of CMG2 after electrical stimulation. The above-mentioned data are all presented as mean ± S.D. Error bars: S.D., gray dots represent individual data points. Statistical significance is calculated with a two-tailed unpaired t-test and P values are indicated (***p <  0.001). Source data are provided as a Source Data file.

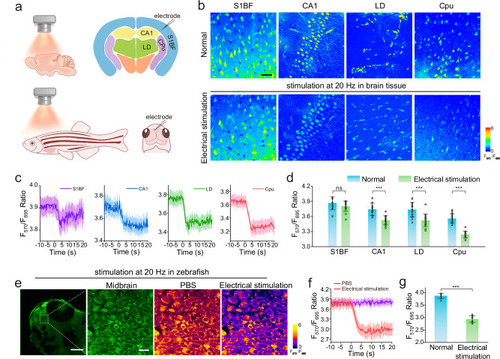
Fluorescence imaging and real-time quantification of EP in brain tissues and zebrafish.

a Fluorescence imaging and real-time quantification of EP in brain tissue and zebrafish. b Fluorescence images of brain tissue slices from S1BF, CA1, LD and Cpu regions incubated with CMG2 after electrical stimulation. Scale bar: 75 μm. c Representative traces of CMG2 in S1BF, CA1, LD and Cpu after electrical stimulation. d Dynamic response summary of CMG2 after electrical stimulation in S1BF, CA1, LD and Cpu (n  =  15 independent experiments). e Fluorescence images of zebrafish incubated with CMG2 after electrical stimulation. Scale bar: 130 μm and 10 μm. f Representative traces of CMG2 in zebrafish after electrical stimulation. g Dynamic response summary of CMG2 after electrical stimulation in zebrafish (n  =  15 independent experiments) The above-mentioned data are all presented as mean ± S.D. Error bars: S.D., gray dots represent individual data points. Statistical significance is calculated with a two-tailed unpaired t-test and P values are indicated (nsp > 0.05, *p  <  0.05, **p  <  0.01, and ***p  <  0.001). Source data are provided as a Source Data file.

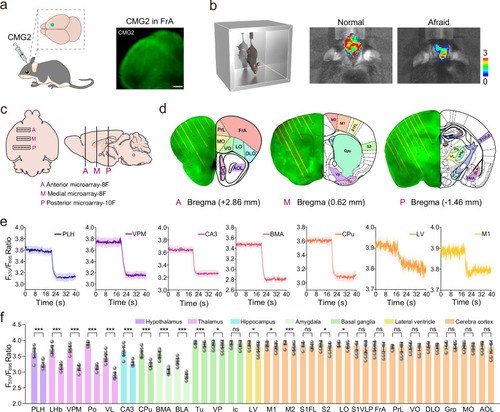
Real-time monitoring and quantifying of EP in 26 brain regions.

a Schematic illustration depicting probe injection and fluorescence imaging in vivo. Example image showing CMG2 in FrA in a coronal brain slice; Scale bar: 500 μm. b Schematic cartoon illustrating tail suspension experiments. In vivo imaging of normal and afraid-model mouse brains stained with CMG2. c An overhead and lateral view of the brain surface implanted with A multi-fiber microarray, including anterior (A) middle (M) and posterior (P). d Distribution of brain slices in different areas and three-dimensional remapping of Allen brain Atlas. e Fluorescence signal F570/F695 ratio changes in seven representative brain regions with time after tail suspension stimulation. f Quantized maps of fluorescence signals in 26 different brain regions (n  =  15 independent experiments). The above-mentioned data are all presented as mean ± S.D. Error bars: S.D., white dots represent individual data points. Statistical significance is calculated with a two-tailed unpaired t-test and P values are indicated (nsp > 0.05, *p  <  0.05, **p  <  0.01, and ***p <  0.001). Source data are provided as a Source Data file.

Acknowledgments
This image is the copyrighted work of the attributed author or publisher, and ZFIN has permission only to display this image to its users. Additional permissions should be obtained from the applicable author or publisher of the image. Full text @ Nat. Commun.