|
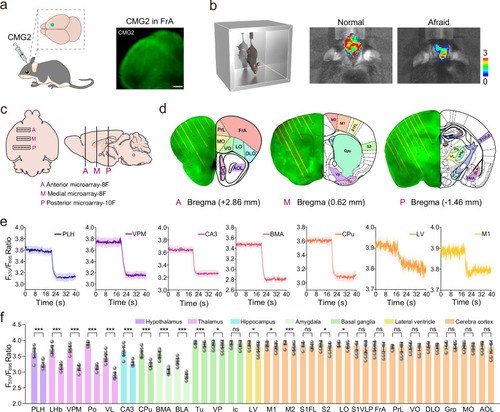
Real-time monitoring and quantifying of EP in 26 brain regions. a Schematic illustration depicting probe injection and fluorescence imaging in vivo. Example image showing CMG2 in FrA in a coronal brain slice; Scale bar: 500 μm. b Schematic cartoon illustrating tail suspension experiments. In vivo imaging of normal and afraid-model mouse brains stained with CMG2. c An overhead and lateral view of the brain surface implanted with A multi-fiber microarray, including anterior (A) middle (M) and posterior (P). d Distribution of brain slices in different areas and three-dimensional remapping of Allen brain Atlas. e Fluorescence signal F570/F695 ratio changes in seven representative brain regions with time after tail suspension stimulation. f Quantized maps of fluorescence signals in 26 different brain regions (n = 15 independent experiments). The above-mentioned data are all presented as mean ± S.D. Error bars: S.D., white dots represent individual data points. Statistical significance is calculated with a two-tailed unpaired t-test and P values are indicated (nsp > 0.05, *p < 0.05, **p < 0.01, and ***p < 0.001). Source data are provided as a Source Data file.
|